.svg)
.svg)



Website speed optimization means getting your pages to load and respond fast enough that Core Web Vitals pass: Largest Contentful Paint (LCP) at or under 2.5 seconds, Interaction to Next Paint (INP) at or under 200 milliseconds, and Cumulative Layout Shift (CLS) at or under 0.1. Start with three moves: run PageSpeed Insights or WebPageTest to see where you stand, shrink and prioritize your LCP image, then turn on caching and a CDN so repeat visits and distant users load quickly too.

Which metrics actually matter, and how do you measure them?
Not every slow page has the same problem, so the first job is naming it correctly. LCP tracks how long the biggest visible element takes to render. First Contentful Paint (FCP) marks the first pixel on screen. INP measures how responsive the page feels when someone clicks, taps, or types. CLS catches visual jank, elements jumping around as the page loads. TTFB (Time to First Byte) tells you how fast your server starts responding before the browser does anything else.
We rely on two different kinds of data to track these:
- Lab data (Lighthouse, PageSpeed Insights) runs a controlled test once, great for debugging before a release.
- Field data (CrUX, the web-vitals library) reflects what real visitors on real networks and devices actually experience.
Lab tests are reproducible but can hide problems that only show up on a mid-range Android phone over a patchy 4G connection, which is exactly what field data reveals. Be careful with test setup, too: clear your cache between runs, pick a server location close to your actual audience, and match device emulation to who really visits your site, or you will end up optimizing for a user who doesn't exist.
Why speed decides whether people stay, buy, and find you
Speed is not a nice-to-have. The 2025 Web Almanac from HTTP Archive found that only 48% of mobile pages and 56% of desktop pages passed all three Core Web Vitals in 2025, meaning roughly half the web is still failing the test visitors judge it by without saying a word.
Nearly half of mobile pages passed Core Web Vitals in 2025, and desktop pages performed somewhat better, according to the Web Almanac, a gap that tracks closely with weaker hardware and slower connections on mobile.
Google folds Core Web Vitals into its ranking signals, so a slow page is working against you twice: once with the visitor deciding whether to stay, and once with the algorithm deciding whether to show you at all. The pain is not distributed evenly. Visitors on older phones or slower connections feel every extra kilobyte and every blocking script far more than someone testing on a new laptop with fiber internet, which is worth remembering before you declare your site "fast enough."
How do you measure site speed today: tools and a testing checklist
Here's a workflow we use to get a real baseline in under an hour, instead of guessing:
- Run PageSpeed Insights for a quick overview combining lab and field data, and note your LCP, INP, and CLS scores.
- Run WebPageTest for a filmstrip and waterfall view; this is where you actually see which request is holding everything up.
- Run Lighthouse in Chrome DevTools with network and CPU throttling enabled, then export the trace for a closer look at long tasks.
- Deploy the web-vitals library on your live site to start collecting real INP, LCP, and CLS numbers from actual visitors.
PageSpeed Insights gives you the fastest read on whether you have a problem. WebPageTest earns its place for the filmstrip, a frame-by-frame view of what the visitor sees, and the waterfall, which lays out every request in the order it fired so you can spot the one oversized image or blocking script delaying everything after it. Lighthouse's trace view is where you find long JavaScript tasks eating the main thread. None of these replace each other; each answers a different question.
Pro Tip:In the waterfall, look for the longest bar that starts earliest. That single request is usually your biggest lever, not the dozen small ones after it.
Core Web Vitals targets and what breaks them
Google's performance guidance sets clear thresholds, and knowing them precisely matters more than knowing them roughly.
Only 48% of mobile pages meet all three Core Web Vitals thresholds, per the Web Almanac, which means failing one of these numbers is still closer to the norm than the exception.
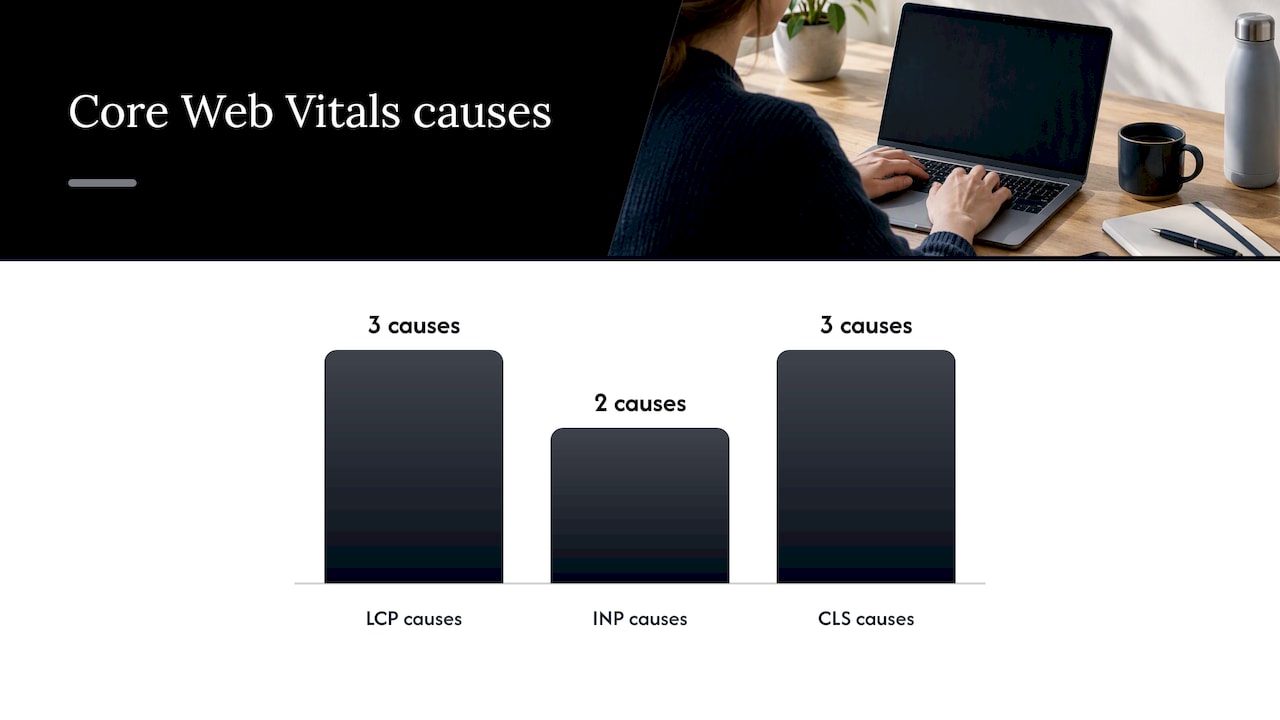
Poor LCP usually traces back to one of three culprits: a heavy hero image or video, a slow TTFB that delays everything downstream, or render-blocking CSS and JavaScript sitting between the browser and the content it needs to paint. Poor INP almost always comes from long tasks hogging the main thread, often triggered by third-party scripts you didn't write and can't easily control. Poor CLS comes from images and ads without reserved dimensions, web fonts that swap in and reflow text, or content injected after the initial layout settles.
High-impact fixes, from five-minute wins to real engineering work
Not every fix carries the same weight, so work through these roughly in order.
- Compress and convert images to WebP or AVIF; this alone often cuts page weight more than anything else on the list, since media dominates page weight on most sites. A partner guide on optimizing images for the web walks through format choice and responsive sizing in more depth.
- Enable Brotli or gzip compression and set far-future caching headers so repeat visits skip the network entirely.
- Put a CDN in front of your assets so users load from a server near them instead of one on the other side of the world.
- Add resource hints (preconnect, preload) for your fonts and your LCP asset specifically.
- Defer or async non-critical JavaScript, inline critical CSS for above-the-fold content, and trim excess DOM nodes; MDN's best practices guide covers the critical rendering path in detail.
- Lazy-load images below the fold, but never the LCP image itself.
- Optimize web fonts: preload the font file used above the fold and set
font-display: swapso text renders even before the custom font arrives. - Reduce TTFB through server-side caching, HTTP/2 or HTTP/3, and server-side rendering for pages where content needs to appear immediately.
- Audit third-party scripts ruthlessly. Every analytics tag, chat widget, and ad script adds JavaScript execution time, and JavaScript carries a CPU cost beyond its file size. Load consent banners and non-essential widgets so they never block the main thread.
Pro Tip:Before adding a new third-party script, ask whether it's worth the fraction of a second it will cost every single visitor, every single time.
Advanced tactics for perceived speed
Once the basics are in place, a handful of newer browser features close the remaining gap between measured and felt speed. Use fetchpriority="high" on your actual LCP image, but never combine it with loading="lazy" on that same image. The two directives fight each other, and modern guidance from Google is explicit that this pairing undermines the browser's preload scanner rather than helping it.
- Use speculation rules to prefetch likely next pages, but check browser support first since coverage is still uneven.
- Apply content-visibility: auto to long off-screen sections to skip rendering work, and pair it with
contain-intrinsic-sizeso you don't introduce a layout shift once that content does render. - Instrument INP with the web-vitals attribution build and Long Animation Frame (LoAF) data to find the exact script or event handler causing slow interactions.
- Break long tasks into smaller chunks and yield to the main thread between them, so the browser can respond to a click or tap instead of finishing a 300-millisecond task first.
Pro Tip:A standard web-vitals build tells you INP is bad. The attribution build tells you which script is responsible, which is the version you actually want running in production.
Keeping speed from regressing once you've fixed it
Speed work that isn't monitored tends to quietly erode, one new feature and one new script at a time. Set a performance budget, a hard limit on page weight, request count, or a specific metric threshold, and enforce it in continuous integration so a pull request that blows the budget fails the build before it ships.
- Run synthetic Lighthouse checks in CI to catch regressions before they reach production.
- Pair that with Real User Monitoring (RUM) to see how actual visitors experience the site across devices and networks you don't control.
- Calibrate budgets against CrUX field data for your own traffic, not a generic target, since a budget built for desktop users will frustrate a mostly-mobile audience.
- Set alerting thresholds so a RUM spike triggers a review within hours, not whenever someone happens to check the dashboard.
Synthetic tests catch the regression you caused; RUM catches the one you didn't see coming, a CDN outage, a new device mix, a third-party script that updated itself without asking.

Speed rules for PWAs and single-page applications
Single-page applications shift the performance problem instead of solving it. The initial bundle still has to load, parse, and execute before anything useful appears, so code-splitting by route is close to mandatory. Ship only the JavaScript a given view needs, and lazy-load the rest behind user interaction.
Client-side routing also breaks the browser's natural progress signals, so each route change should update the document title and manage focus, otherwise CLS and perceived responsiveness both suffer even when the raw numbers look fine. For progressive web apps specifically, a service worker that pre-caches your shell and critical assets can make repeat visits feel close to instant, but an overly aggressive cache strategy can also serve stale content, so version your cache keys carefully.
Hydration is where many frameworks lose the INP battle: a page that looks ready but can't yet respond to a tap is worse than one that's visibly still loading. Where possible, stream server-rendered HTML first and hydrate progressively rather than all at once, so the main thread stays free for actual user input.
How hosting choice shapes every other metric you chase
The fixes above only get you so far if the server itself is slow to respond. Shared hosting typically means your TTFB depends partly on how busy someone else's site is at that moment, which makes consistent performance hard to guarantee. A virtual private server gives you dedicated resources and more predictable response times, at the cost of more setup work.
Managed platforms built around caching and edge delivery tend to produce the most consistent TTFB because the caching layer and the CDN are already integrated rather than bolted on afterward. Serverless and edge-function setups can cut latency further by running code physically closer to the visitor, though cold starts can introduce their own delay if a function hasn't run recently. Whichever route you take, TTFB under 0.8 seconds, the threshold Google recommends, is the number to hold hosting accountable to, since everything downstream, LCP included, depends on how fast that first byte arrives.
Mobile speed needs its own plan, not a scaled-down desktop one
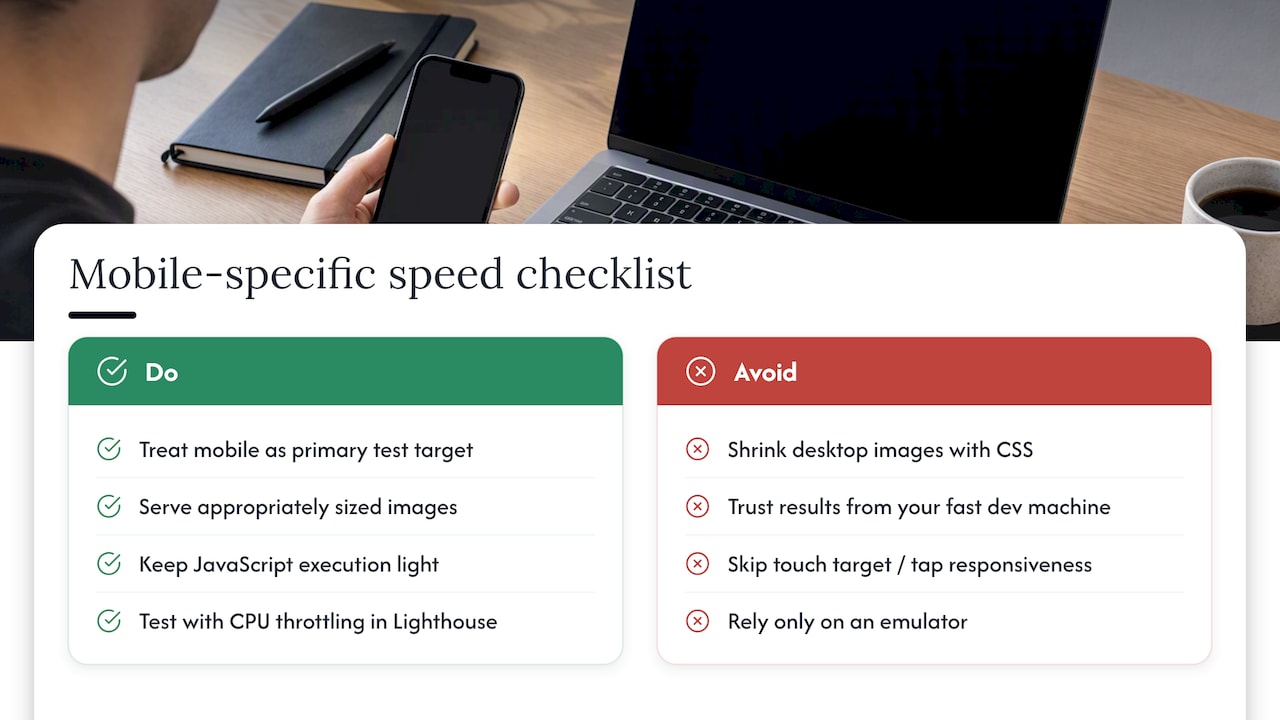
Mobile visitors are not just using a smaller screen, they're often on weaker hardware and less reliable networks, which is exactly why the Web Almanac found mobile Core Web Vitals pass rates trailing desktop. Treat mobile as the primary test target, not an afterthought you check once desktop is done.
Serve appropriately sized images through srcset rather than shrinking a desktop image with CSS, since the browser still downloads the full file either way. Keep JavaScript execution light: a mid-range phone's CPU can take several times longer to parse and run the same script than a desktop machine does, which hits INP directly. Test with CPU throttling enabled in Lighthouse to simulate that gap rather than trusting a result from your own fast development machine.
Touch targets and tap responsiveness matter for INP specifically, since a delayed response to a tap feels worse on mobile than the equivalent delay feels with a mouse click. Finally, test on an actual mid-range Android device when you can. An emulator is a reasonable proxy, but nothing exposes real-world jank quite like the hardware your visitors are actually holding.
A step-by-step order to work through your fixes
When everything looks broken, the question is what to fix first. Work through it in this order:
- Measure a baseline with PageSpeed Insights and WebPageTest before changing anything, so you can prove what actually improved.
- Fix LCP first, since it's usually the most visible problem and the one most tied to a single asset or request.
- Address CLS next, because layout shift fixes (sizing images, reserving space for ads and fonts) are often quick and low-risk.
- Tackle INP last, since it typically requires the most code-level investigation, including attribution data to find the offending script.
- Re-test and compare against your baseline, then move to the next page template rather than trying to perfect one page in isolation.
This order is not arbitrary. LCP fixes tend to be the fastest to implement and the easiest to verify, which builds momentum before you take on the more involved main-thread work that INP usually demands.
Where speed and design meet: a practitioner's view
We treat speed as a design constraint from day one, not a cleanup task at the end. Inside our Design Sprint and RapidMVP frameworks, performance budgets get set alongside the first wireframes, because a beautiful layout that loads slowly is a conversion problem wearing a design problem's clothes. We've written before about this exact tension in performance versus design, and the short version holds: the trade-off is rarely as steep as people assume once you design with the constraint in mind from the start rather than retrofitting it.
When we run a performance-focused engagement, expect a baseline audit, a prioritized fix list ordered the way this article orders one, and measurable before-and-after Core Web Vitals data.
, Philippe
Get a free audit of your site's speed and conversion gaps
We built our Full UX/CRO Audit to catch exactly the kind of speed and usability issues this article walks through, the heavy LCP image, the blocking script, the layout shift nobody noticed until a customer complained. If you want a lighter starting point first, our free UX audit gives you a direct look at where your site is losing visitors before you commit to anything.

Here's what we offer once you're ready to move past diagnosis:
- A Full UX/CRO Audit that pairs speed findings with conversion recommendations, from $2,500 one-off.
- Web development for teams that want the fixes built and shipped, not just listed.
- A free UX audit if you want a no-commitment first look at what's slowing your site down.
Book a call or request your audit through the links above, and we'll walk you through what we find.
Discuss Your Website's Performance
Email Raw Studio to discuss data-driven design, conversion optimization, UX/UI, branding, or web development for your business. [email protected].