.svg)
.svg)

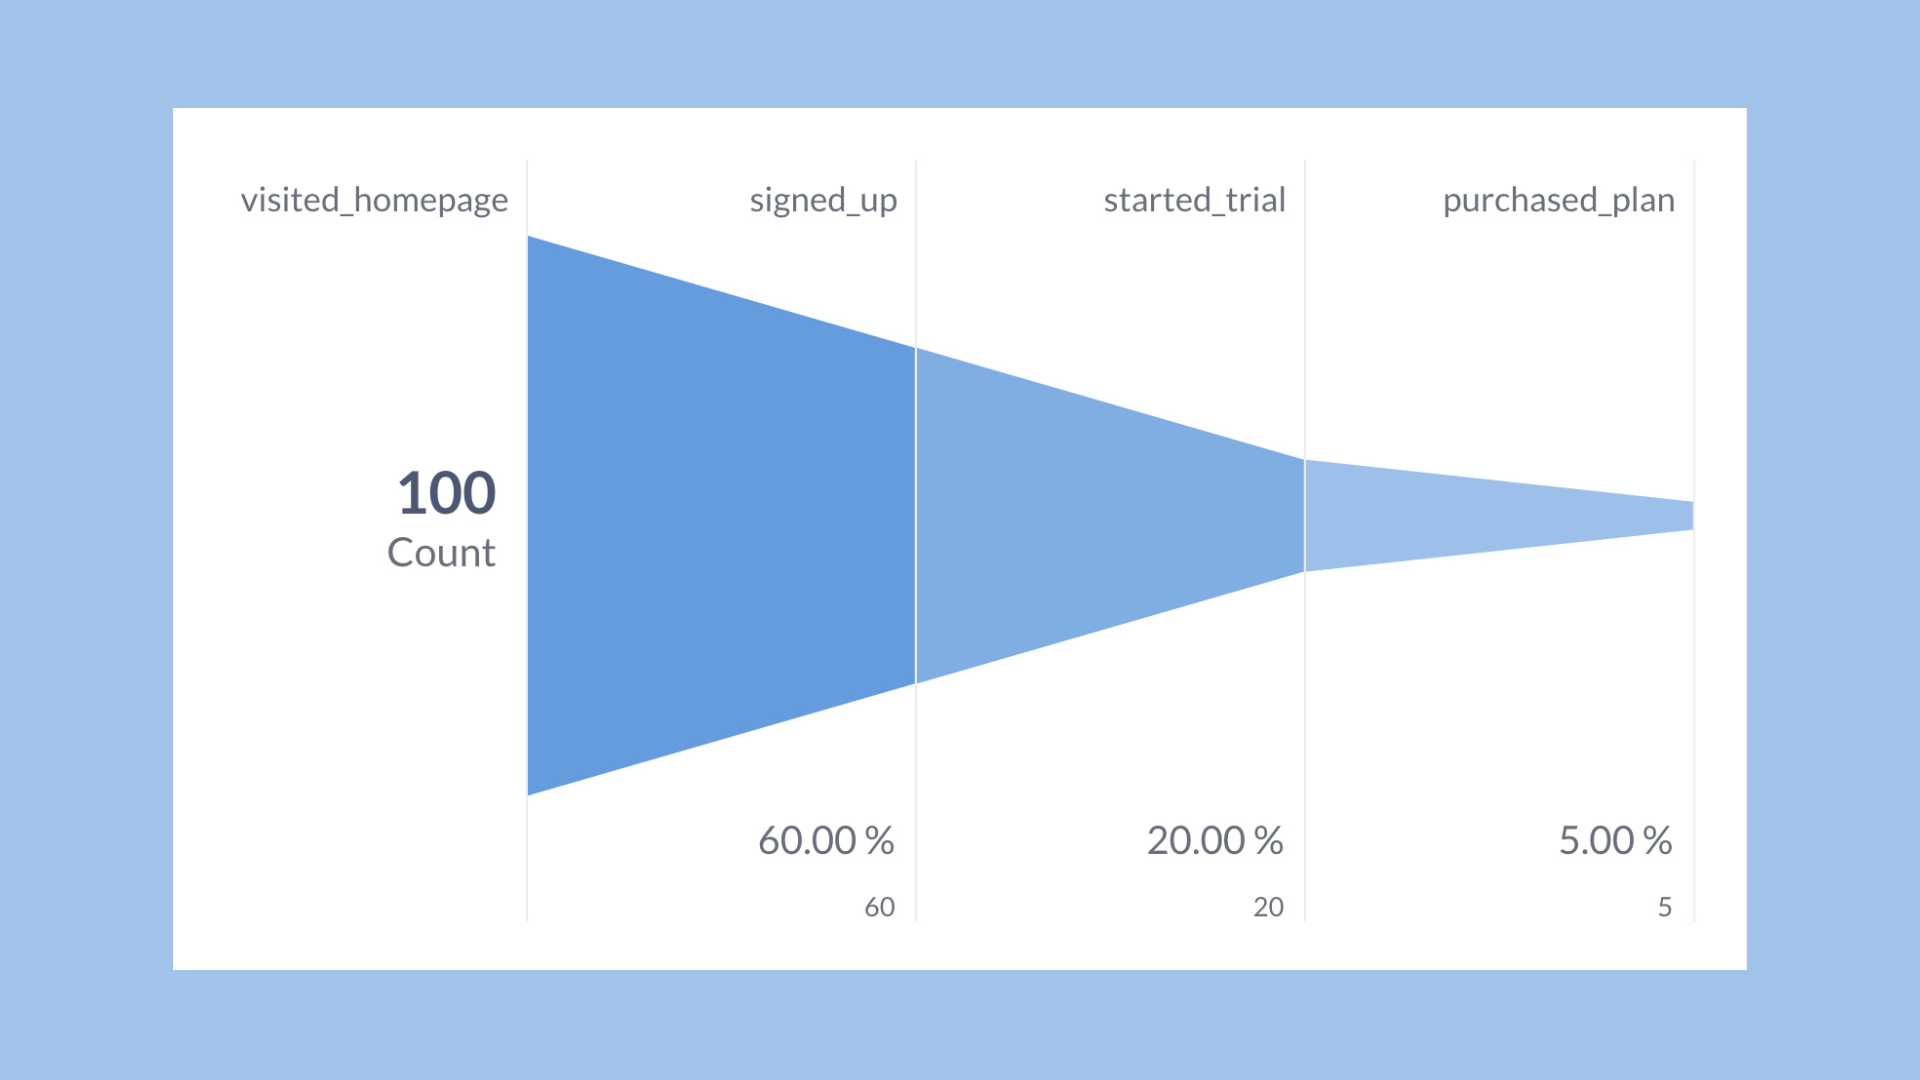

Funnel analysis maps the ordered steps users take to a conversion so you can find the exact pages or events where value leaks and prioritize fixes that lift revenue. We built this guide to walk you through the definitions, the types of funnels worth building, a step-by-step workflow, the metrics that matter, and the tools we see teams succeed with. By the end, you will have a method, not just a concept.
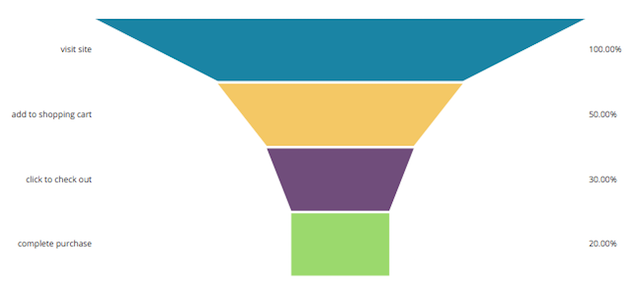
What is funnel analysis?
A funnel is an ordered sequence of steps, usually pageviews or events, that a user moves through on the way to a goal: signing up, buying, upgrading. Funnel analysis measures how many people complete each step and where they drop off, giving you a visual and numerical account of where attention and intent disappear. Matomo's guide to funnel analysis frames this clearly: the goal is to see which stage leaks the most value, not just the overall conversion rate.
A few concepts shape how you read a funnel:
- Open funnels let users enter at any step, which suits broad discovery analysis.
- Closed funnels require entry at step one, which sharpens cohort comparisons.
- Counting rules vary by platform and report mode. Document whether you count users, sessions, or attempts, along with re-entry, ordering, identity, and conversion-window rules. Mixpanel's two-second grace period allows near-simultaneous steps to be interchangeable; it is not a mandatory delay before completion or a universal rule across platforms. Mixpanel counting guidance
Why funnel analysis matters for revenue and experience
Funnel analysis turns a vague sense that "conversions are low" into a specific, fixable problem. Instead of guessing, you locate the step where people actually quit and build evidence for what to fix first.
- Pinpoints high-impact leaks so engineering and design effort goes where it pays off.
- Reduces wasted acquisition spend by improving what happens after the click, not just the click itself.
- Strengthens retention because the same instrumentation that catches a purchase drop-off also catches an onboarding stall.
A funnel analysis practice gives you a repeatable way to separate real friction from noise, a distinction that matters more as traffic sources and devices multiply, according to Matomo's breakdown of funnel analysis benefits.
Types of funnels and when each one fits
Different questions call for different funnel shapes. Picking the wrong one gives you a technically correct number that answers nothing useful.
- Pageview funnels track movement across a fixed page sequence, useful for checkout flows with set URLs.
- Event-based funnels track actions regardless of page, better for app or SaaS flows where the same screen handles multiple intents.
- E-commerce purchase funnels typically run product view, add to cart, checkout started, payment completed, a sequence Matomo uses as the standard retail example.
- Trended (line) funnels show daily or weekly volatility, while stepped funnels show the conversion ratio across one fixed window, per GA4's funnel exploration documentation.
- Open versus closed configuration changes your baseline population, so choose based on whether you need broad discovery or strict cohort comparison.
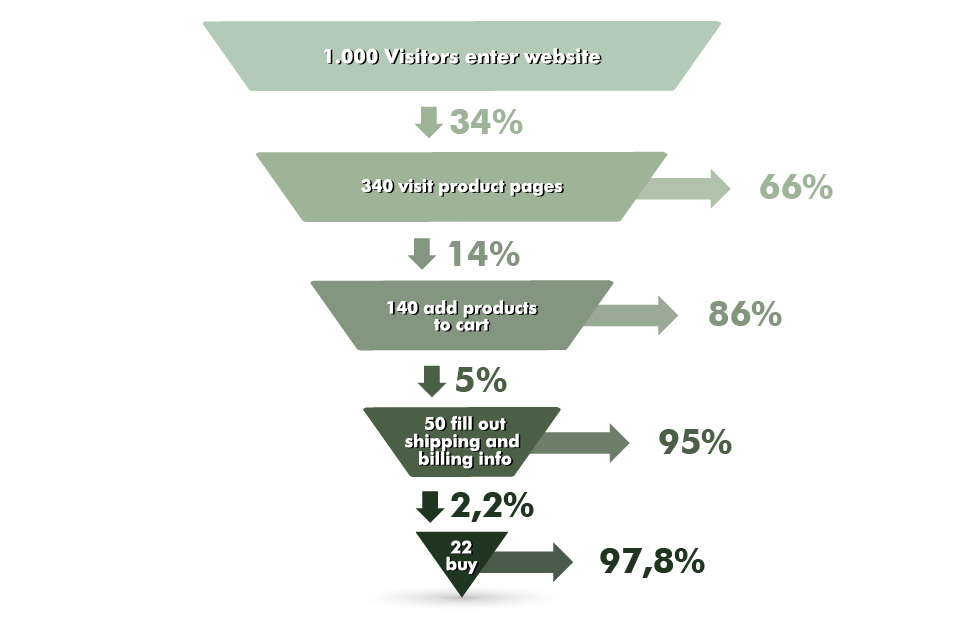
How to conduct funnel analysis: a step-by-step workflow
This is the sequence we recommend running end to end, whether you are auditing a SaaS trial flow or a retail checkout.
- Map the stages using real user behavior, not your assumed ideal path. Pull a sample of session recordings first if you are unsure what the actual journey looks like.
- Define events and conditions for each step, and set a conversion window that matches your sales cycle. A same-day impulse purchase needs a different window than a 30-day B2B trial.
- Verify tracking before trusting any number: check UTM consistency, confirm events fire once per action, and stitch identity across devices where possible.
- Build the funnel exploration or report, choosing open or closed and trended or stepped based on the question you are answering. GA4's funnel exploration tool supports up to ten steps with segment comparison built in.
- Segment by source, device, and new versus returning to see whether the leak is universal or isolated to one channel.
- Use next-action and top-actions breakdowns to see what people do instead of converting, which often points straight at the fix.
- Use heatmaps, session replay, and user research to investigate the high-drop-off step. These sources can suggest explanations; they do not prove why the drop occurred. Turn the evidence into a testable hypothesis.
- Prioritise fixes using absolute user loss alongside expected revenue, severity, affected segments, confidence, and effort. The largest drop is a candidate for investigation, not automatically the most valuable experiment.
- Run a controlled experiment with planned allocation, a primary metric, guardrails, and a sample-size or stopping plan. Compare concurrent groups rather than relying only on a before-and-after change; examine conversion and elapsed time where relevant.
Pro Tip:Save your funnel as a report once the configuration is stable, GA4 preserves the step definitions and filters, which keeps your monthly numbers comparable instead of quietly drifting, per Google's guide to custom funnel reports.
Key metrics and how to interpret them correctly
Raw funnel data is only useful once you read the right numbers the right way.
- Conversion rate between steps is simply users who completed step B divided by users who reached step A, and it tells you where the biggest proportional loss happens.
- Abandonment and retention rates appear directly beneath each step in GA4's saved funnel reports, showing the mirror image of conversion at a glance, per Google's documentation.
- Elapsed time between steps, a toggle available in GA4's funnel exploration, flags friction: a long gap between "added to cart" and "started checkout" often signals confusing pricing or an unexpected shipping cost.
- Cohort analysis extends this further by tracking the same group of users across repeat visits, revealing whether a fix improves one-time conversion or ongoing retention.
Small segments can produce unstable conversion estimates. Mixpanel's hypergeometric calculation compares a segment against the overall funnel population; it is not a generic A/B test or proof that a design caused a change. Report counts and uncertainty, and account for the number of segments examined before acting on a percentage lift.
Tools and reports for running funnel analysis
Start with whichever tool already holds your data rather than adding a new platform before you need one.
- GA4's funnel exploration and custom funnel reports work well for marketing-led teams who need segment comparison, trended versus stepped views, and the elapsed-time toggle described in Google's funnel documentation.
- Adobe Customer Journey Analytics suits larger organizations stitching together multiple data sources into one cross-channel funnel.
- Matomo offers a privacy-focused alternative with its own funnel visualization, detailed in its guide to funnel analysis.
- Mixpanel is built for event-based, product-led funnels and documents its counting logic transparently in its funnels FAQ.
- Heatmaps and session replay tools diagnose the "why" behind a drop-off once the funnel report shows you the "where," a pairing Search Engine Land recommends for single-page bottlenecks.
- CRMs and data warehouses pick up where on-site funnels stop, tracking post-conversion behavior and lifetime value by cohort.
Our practical framework: turning funnel insight into tests and wins
We run funnel work through a simple loop: research, then a design sprint or RapidMVP prototype, then instrumentation, then controlled experiments, then measurement against the original baseline. The checklist we use on every CRO-focused funnel audit covers four things.
- Data hygiene: confirm events and UTMs are consistent before trusting any funnel number.
- Step naming: use plain, consistent labels so stakeholders outside analytics can read the funnel too.
- A prioritized backlog: rank experiments by estimated user impact, not by ease of implementation.
- A measurement plan: define upfront how you will know a test won, including which metric and what sample size.
Pro Tip:Common UX issues like unclear pricing or a buried CTA often explain a surprising amount of drop-off; our breakdown of UX mistakes that kill SaaS conversion covers the patterns we see most often.
Embedding funnel analysis into your team's cadence
Funnel review works best as a habit, not a quarterly fire drill. We favor a weekly or sprint-aligned check where one small experiment gets shipped, measured, and documented where the whole team can see it. Product and marketing should share ownership: product owns instrumentation and experiment execution, marketing owns channel and messaging hypotheses, and both read the same funnel report.
Philippe
How Raw Studio can help with CRO audits and design sprints
If reading a funnel report is easy but fixing what it reveals is not, that is the gap we work in. Our Full UX/CRO Audit gives you a prioritized roadmap of fixes ranked by impact, not a generic checklist. For teams that want ongoing support, our services page covers UX design, UI design, conversion rate optimization, and web development as standalone engagements.
- A Design Sprint or RapidMVP turns a funnel finding into a tested prototype in days rather than months.
- A Full UX/CRO Audit gives you a prioritized backlog of experiments tied to specific funnel steps.
- Our Design Team retainer keeps that experiment cadence running continuously.
Start with a free UX audit to see exactly where your own funnel is leaking.