



Reduce churn by measuring it correctly, diagnosing the root cause by cohort, and then fixing the biggest levers in order: billing recovery, onboarding and time-to-value, customer success, and the product habits that keep people coming back. This is a practical playbook for operators, not a vendor pitch. Start with the quick wins, then move to the bigger rebuilds.

How do you measure SaaS churn correctly?
Before you change anything, make sure the number you are trying to move is real. Plenty of teams "fix" churn that was never broken, or miss churn that is quietly eating their growth, because the metric was defined loosely.
Start with two splits. Logo churn counts customers who leave. Revenue churn counts the recurring revenue that leaves with them. A startup losing many small accounts can have ugly logo churn and healthy revenue churn, and an enterprise-heavy business can show the opposite. Then split by cause: voluntary churn is a customer deciding to cancel, while involuntary churn is a payment that failed and was never recovered. They have different owners and different fixes, so never blend them into one number.
Define these four measures consistently:
- Monthly logo churn: customers lost during the month divided by customers at the start of the month.
- Gross monthly revenue churn: MRR lost to cancellations and downgrades from the opening customer base divided by its starting MRR. Exclude new accounts and expansion; report expansion separately in NRR. Keep annual and monthly measurement periods consistent.
- Cohort retention: the share of a signup cohort still active at month 1, 2, 3 and beyond.
- Net revenue retention: starting MRR plus expansion, minus contraction and churn, divided by starting MRR. Use only the opening customer base; exclude new-customer MRR and state how reactivations are treated.
Use logo churn when you sell many similar accounts and want to see product-market fit. Use revenue churn when account sizes vary widely, because one lost enterprise contract can outweigh dozens of small ones.
Cohort analysis is where the truth lives. A blended churn rate averages new customers, who churn fast, with mature customers, who rarely do. If your base is growing quickly, the blended number can look fine while every new cohort retains worse than the last. Plotting retention curves by signup month shows whether your fixes actually changed behavior.
Common mistakes to avoid:
- Dividing by the end-of-month customer count instead of the start.
- Counting new customers who signed up and left within the same month inconsistently.
- Ignoring downgrades, which are partial churn that logo metrics hide.
- Mixing monthly and annual plans in one rate without normalizing.
Benchmarks help you sanity-check, but pick them carefully. Public benchmarks vary by segment and contract length, so compare yourself to companies with similar pricing and customers.
A note on retention economics: a widely cited Harvard Business Review analysis argues that retaining customers is generally cheaper than acquiring new ones, which is why we treat a clean churn metric as the first investment, not the last.
How do you diagnose why customers leave?
Once the metric is trustworthy, run a diagnosis before you build anything. You can complete it in a few days with the data you already have, and it stops you from guessing.
- Segment first. Split churn by plan, account size, acquisition channel and industry. If one segment drives most of the loss, you have a targeting or packaging problem, not a product-wide one.
- Build retention cohorts. Plot monthly signup cohorts and look for the month where the curve drops. A sharp early drop can point to onboarding. A gradual decline later may point to value decay or pricing.
- Inspect event funnels. Map the path to your first meaningful outcome and find where people stall. Which step loses the most users? That is your first experiment.
- Tag risky accounts. Flag customers whose key activity dropped, who never finished setup, or who went quiet after a support complaint. Tagging turns a retrospective into an early-warning list.
- Interview the leavers. Pair the numbers with the human story: cancellation survey answers, NPS follow-ups, exit interviews and a sample of support transcripts.
Three product events tend to predict churn better than logins do: time to first value (how long until the customer gets their first real result), failed key flows (errors or abandoned steps in the core workflow), and feature non-adoption (never touching the capability that makes your product sticky). Logins are noisy. A user can log in daily and still never get value.
Qualitative work matters because analytics tells you where people leave, not why. A short, well-placed cancellation survey with one required question and one optional free-text box outperforms a long form nobody finishes. If you want to redesign that moment, our post on reducing churn with a good customer cancellation flow walks through it.
Pro Tip:Read cancellation comments before opening a dashboard. Patterns jump out of raw language that no chart will show you, and you will form sharper hypotheses to test.
A sprint-sized checklist keeps this moving: confirm metric definitions, build the cohort chart, pick the biggest funnel drop, tag at-risk accounts, run exit interviews, and write down one hypothesis per finding. If you want a head start on the product side, our UX audit is a way to spot friction you may have gone blind to; current prices are on our pricing page.
How do you stop involuntary churn fast?
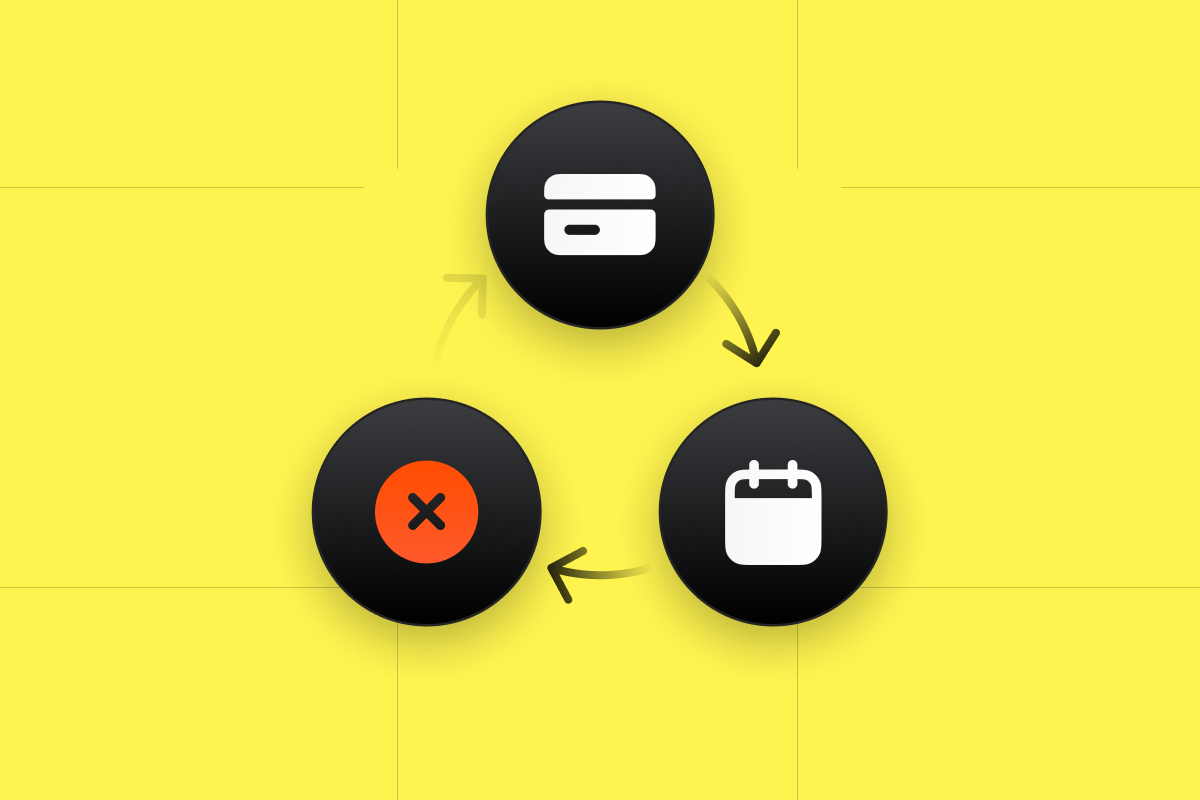
Billing recovery can reduce involuntary churn when recoverable payment failures account for a meaningful share of losses. Diagnose the decline reason first: some failures can be retried, while others need a new payment method or customer action. Measure your own recovery results rather than assuming all failed payments represent customers who want to stay.
The common causes are predictable:
- Expired or replaced cards after a reissue.
- Insufficient funds or temporary bank declines.
- Gateway or processor errors that look like declines.
- Banks rejecting recurring charges as suspicious.
Combine processor-supported retries, clear dunning messages, supported card-updater services and timely payment prompts. Respect retry limits and decline reasons. For example, Stripe's Smart Retries documentation distinguishes recoverable failures from hard declines that require an updated payment method. Provide a secure, straightforward route to update billing details.
The UX around recovery matters as much as the mechanics:
- Make updating a card a one-click path from the email, with no forced login maze.
- Offer more than one payment method, such as a card plus a bank debit or wallet.
- Keep access alive for a short grace period so customers do not feel punished by a bank error.
- Show a plain in-app banner while a payment is failing, rather than silently cutting service.
Measure it like any other funnel. Track recovery rate (failed payments later collected divided by failed payments), involuntary churn rate as its own line, and days to recovery. If recovery climbs and involuntary churn falls over time, the fix may be working.
Pro Tip:Tag every cancellation as voluntary or involuntary at the moment it happens. Teams that skip this step spend months trying to win back customers who simply had an expired card.
How does onboarding shorten time-to-value?
Early churn can signal onboarding friction, but it can also reflect poor fit, acquisition promises, pricing or reliability. Define a first-success event and test whether helping the right customers reach it improves later retention.
Start by naming your first-success event: the earliest action that correlates with long-term retention. For a project tool it might be "created a project and invited a teammate." For an analytics product it might be "connected a data source and viewed a report." Instrument it, then measure how many new accounts reach it and how fast. Everything else in onboarding exists to move that number.
Why this matters:Userpilot's churn research emphasizes that users who do not reach value early are the most likely to leave, which is why activation rate is the leading indicator we watch hardest.
Tactics that tend to work, roughly in order of effort:
- Cut setup steps. Remove every field and decision that is not required for the first win, and defer the rest.
- Add an in-app checklist with three to five milestones tied to real value, not feature tours.
- Send milestone-based emails, triggered by what the customer did or skipped, instead of a fixed drip.
- Personalize the path by role or goal, asked in one short question at signup.
- Offer a welcome call for higher-value accounts, aimed at getting them to the first win rather than demoing everything.
Watch three numbers: activation rate, time to first value, and early-cohort churn over the period most relevant to your business. If you want a deeper treatment of the design side, our nine UX tips for user onboarding covers the screens and copy, and our onboarding and retention webinar shows the workshop format we use with teams.
Small experiments beat big redesigns here. Try changing the email cadence, adding one guided setup step, or surfacing success landmarks inside the product, then compare the next cohort's activation against the last. Because cohorts are the unit of measurement, you will know within a few weeks whether the change helped.
What should customer success and support playbooks look like?
Customer success does not reduce churn by being friendly. It reduces churn by reaching the right accounts with the right motion before they decide to leave. That takes segmentation, a risk signal and a few disciplined routines.
Separate high-touch from low-touch playbooks. High-touch means a named owner, scheduled check-ins and executive alignment, and it only pays off when account value justifies the cost. Low-touch means automated nudges, community content, office hours and triggered emails. Most SaaS businesses need both, and the dividing line is usually contract value and complexity of the product.
Next, build a simple risk score. You do not need a data science team. Combine a handful of signals, such as recent usage trends, drop in seats or active users, rising support volume or unresolved tickets, missed onboarding milestones, and billing issues. Weight them, review the top of the list weekly, and adjust as you learn which signals actually predicted cancellations.
Then attach actions to the score:
- Win-back cadence: a short, human sequence for accounts that went quiet, starting with a useful question rather than a discount.
- Escalation flow: a clear path from support to success to leadership when a high-value account is unhappy.
- SLA hygiene: respond inside the promised window, and close the loop on every bug report that a customer cared about.
- Renewal prep: begin the conversation well before the renewal date, with a summary of outcomes achieved.
Track the KPIs that tie to retention rather than activity: renewal rate, expansion revenue, health score distribution, and time to resolution for at-risk accounts. Calls made and emails sent feel productive but do not predict keeping a customer.
Pro Tip:Ask every churned account one question during the exit conversation: "What would have needed to be true for you to stay?" The answers tend to cluster fast and feed your product backlog directly.
How do product improvements and retention loops reduce churn?
Retention is ultimately a product outcome. Support and success can slow the bleeding, but customers stay when the product becomes part of how they work. That means building habits, not just features.
Prioritize with a plain impact-versus-effort lens, but score impact against cohort retention curves, not raw usage. A feature that gets clicked a lot but does not improve cohort retention may be entertainment. A small change that moves more users to a second week of activity is worth more than a big launch.
Practical ways to build retention loops:
- Create repeated value triggers. Find the reason a customer should come back weekly, such as a report, a reminder, a shared deliverable or a teammate action, and make that trigger arrive without the customer remembering to ask.
- Sequence features by readiness. Introduce advanced capabilities after the basic win, using contextual prompts, not a wall of tooltips on day one.
- Target releases by cohort. Announce new capabilities to the segments who will actually use them, so the message feels relevant rather than noisy.
- Remove friction at the drop-off points your funnel analysis exposed, whether that is a confusing settings page, a clumsy import or an unclear empty state.
- Test against retention, not clicks. Judge each experiment by whether the treated cohort holds on longer, and give it enough time to show up in the curve.
UX and conversion work belongs here more than most teams expect. Many "retention problems" are really usability problems: unclear navigation, buried core actions and inconsistent patterns. Our post on enhancing SaaS with UX and UI and our breakdown of UX mistakes that kill SaaS conversion are good places to find the usual suspects.
How do pricing, contracts and incentives lower voluntary churn?
Sometimes customers do not leave the product. They leave the price. When packaging does not match how people use your software, they feel they are overpaying for what they use or locked out of what they need, and cancellation becomes the only lever they can pull.
Look at who churns right after a price tier or a renewal. If customers on one plan cancel at a disproportionate rate, check whether the plan bundles features they never touch or caps something they hit constantly. Misaligned packaging produces downgrades first and cancellations later, so watch contraction as closely as logo loss.
Tactics worth testing:
- Usage-based or flexible tiers that let a customer's bill track the value they receive, so a quiet month does not feel like a waste.
- Annual prepay discounts, which lock in commitment and reduce the number of monthly decision points, as long as customers are already getting value.
- Downgrade-friendly flows that let someone move to a smaller plan instead of canceling, preserving the relationship and the data.
- Pause options for seasonal or budget-constrained customers.
- Simple win-back incentives offered at cancellation or soon after, kept modest so you do not train people to cancel for a discount.
Transparency is a retention tool too. Send clear auto-renew notices, make the downgrade path easy to find, and pair that with a targeted offer at the moment of cancellation. Customers who feel tricked leave angry and tell others, while customers who feel respected sometimes return.
Treat every pricing change as an experiment. Compare the treated group's churn, contraction and expansion against a control over an appropriate test period, and judge success on net ARR, not conversion to a discount alone.
Which dashboards and KPIs should you review every week?
A fix that is not monitored decays. The teams that keep churn low run a short, weekly review on the same handful of charts, so problems surface while they are still cheap to solve.
A useful weekly dashboard includes:
- Cohort retention curves, with the latest cohorts overlaid on older ones.
- Activation rate and time to first value by cohort.
- Payment failure rate, recovery rate and involuntary churn.
- Health-score distribution across active accounts.
- Support volume and unresolved tickets for high-value accounts.
Distinguish leading indicators from lagging ones. Usage decline, stalled onboarding and rising failed payments are leading: they move before a customer leaves, so alert on them. Monthly churn rate is lagging: it confirms what already happened, which makes it a scorecard and not a steering wheel. Set thresholds on the leading signals and route alerts to whoever owns the fix.
Retention compounds: a frequently cited Bain & Company finding on loyalty economics argues that small gains in retention can disproportionately lift profits, which is why we review the same few charts weekly instead of chasing every new metric.
Protect your experiments with guardrails. Define in advance which retention metric must not worsen, watch it during the test, and roll back quickly if it does. A change that lifts conversion but harms later retention is a loss dressed up as a win.
Finally, keep your data honest. Use consistent event names, confirm instrumentation after every release, and give each metric a single owner who maintains its definition. Most arguments about churn turn out to be arguments about definitions.
How does an agency-led UX and CRO engagement reduce churn?
Some teams have the data and the will but not the capacity to run a dozen experiments at once. That is where an outside engagement can help, as long as it is built around measurable outcomes and not a redesign for its own sake.
A typical workflow at our studio looks like this:
- Analytics and interviews first: we review your funnels, cohorts and cancellation feedback, and talk to real customers and leavers.
- Prioritized experiments: findings become a ranked backlog, scored by likely retention impact and effort.
- Rapid validation: we use a Design Sprint or Rapid MVP to test the riskiest ideas with users before engineering commits.
- Measured rollout: compare changes with a suitable concurrent control where feasible; historical cohort differences alone do not establish causation.
The deliverables that matter most for churn are an onboarding redesign, a billing and cancellation UX overhaul, and a set of targeted retention experiments. Success looks like a higher activation rate, a shorter time to first value and lower churn in early cohorts, not a prettier interface.
My take: what I would prioritize with a small team
Most teams I talk to want a grand retention strategy, and most of them would do better with a short list and a calendar. If I had to run churn work with a small team and limited time, here is where I would put my attention:
- Check billing recovery first. Prioritise it when recoverable payment failures are a meaningful share of lost revenue.
- Investigate time to first value next. Use early cohorts and customer feedback to identify where onboarding improvements are likely to help.
- Hold a weekly churn review. Keep it focused on the same charts, with one owner per action.
- Keep a small experiments backlog. Three well-chosen tests beat fifteen half-started ones.
Be honest about timelines, too. Billing fixes can show up in the numbers after the changes take effect. Onboarding changes need a few cohorts to prove themselves, and product-driven retention lift often takes months. Nothing here is instant, and anyone who promises otherwise is selling something.
How can we help you reduce churn?
If you want help moving from diagnosis to experiments, our Full UX/CRO Audit starts from $3,500 plus GST as a one-off. Our UX/UI Design Team starts from $8,400 per month plus GST. Check the current pricing and scope, then choose an engagement around the retention problem you need to investigate.

Not ready to commit? Start with our UX audit to see where friction is hiding; current prices are on our pricing page. Or explore our services and tell us where your cohorts drop off.