




Sentry is a strong starting point when your main question is "why did this code break for this user?" Datadog is a strong starting point when you need visibility across servers, services and cloud accounts. Both also cover overlapping application workflows. Choose around the incidents your team must investigate, who owns the setup and the full cost of collecting useful data. Running both is an option, but requires deliberate configuration and ownership.
We're a design and product agency, not a monitoring vendor. But we spend our days on the other side of this decision: watching what happens to users when a release goes wrong, and helping teams connect that to conversion and engagement. That vantage point shapes how we read this comparison.
What each tool is built to do
The confusion between these two comes from overlap. Both can show you an error, a slow request and a trace. They arrive there from opposite directions.
Sentry: start from the code
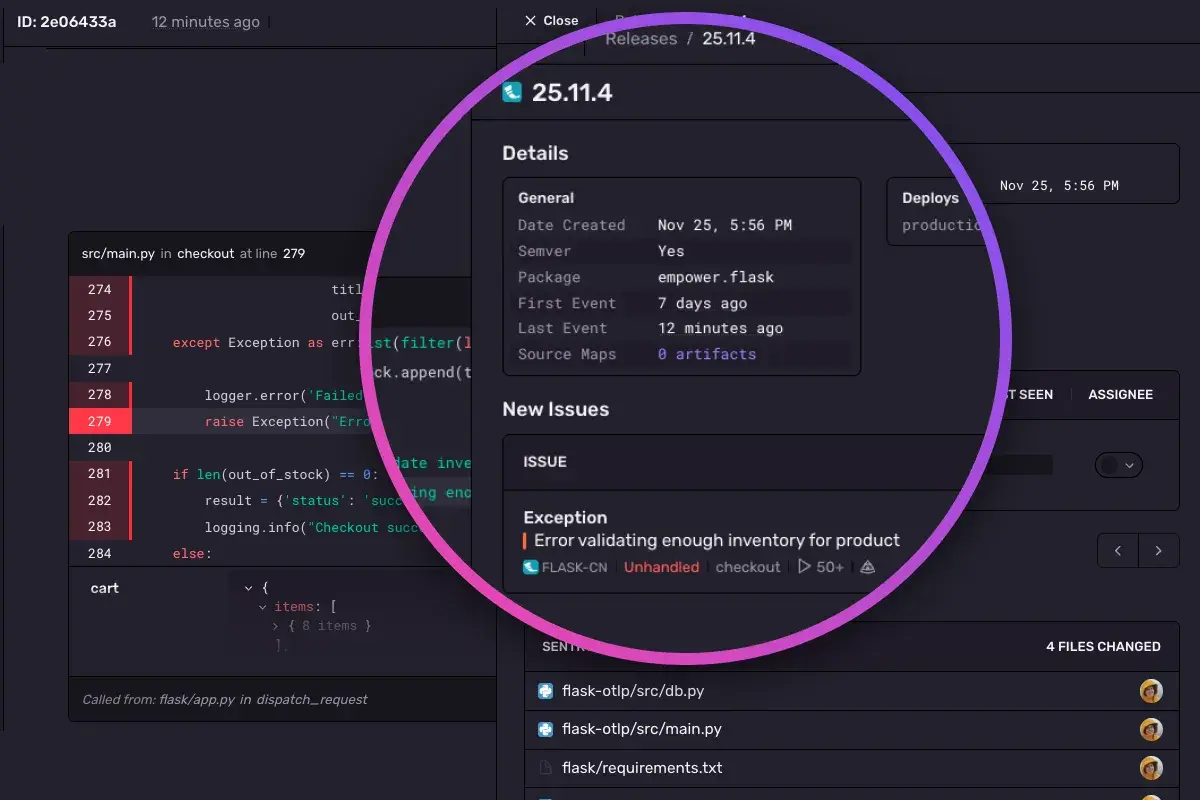
Sentry is an application monitoring platform focused on developer debugging. Its scope includes errors, tracing, replay, profiling, logs and other monitoring features. Availability and instrumentation requirements vary by SDK, platform and plan; check the documentation for your actual stack.
In practice, you add an SDK to your app and Sentry captures exceptions with a stack trace, the release that introduced them and the context around them. The iOS guide shows the pattern: the SDK captures errors and exceptions, traces interactions across services, collects production performance profiles and can optionally record session replays, logs and performance data.
Datadog: start from the environment
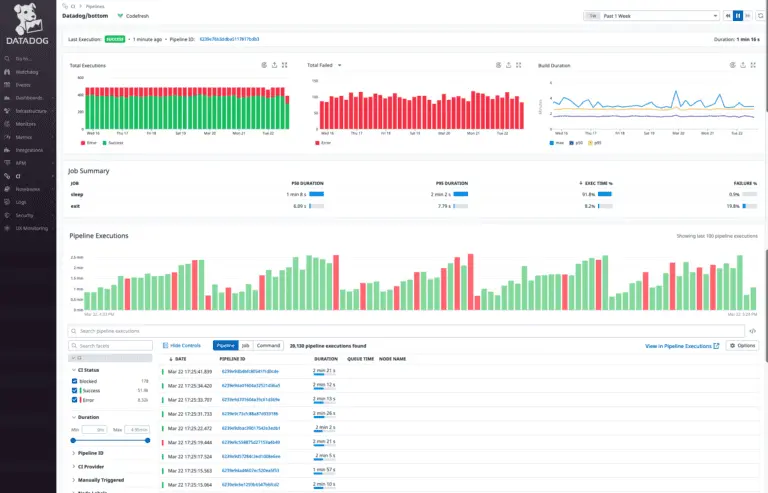
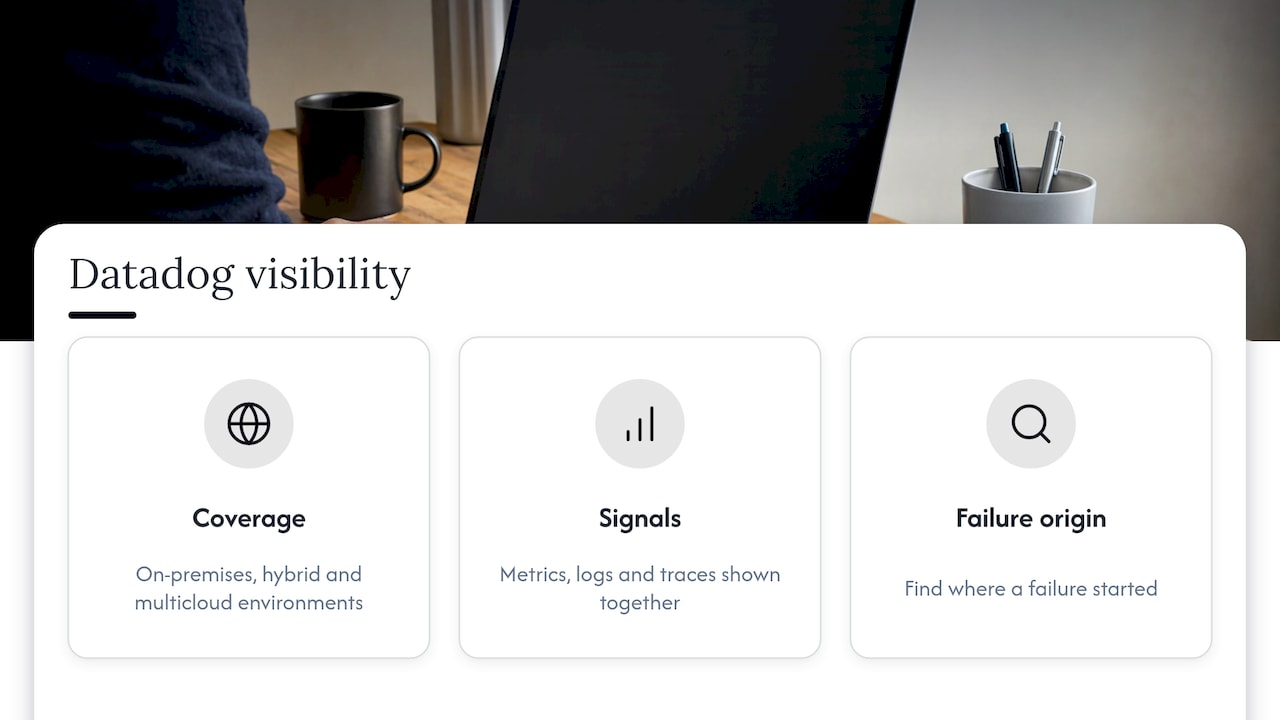
Datadog is designed for wider operational visibility. AWS's public sector blog describes it as unified monitoring across on-premises, hybrid and multicloud environments, covering metrics, logs, traces, service discovery, dependency mapping, APM, distributed tracing and Kubernetes visibility.
The value there is correlation. When a failure crosses an application, a database node and a cloud boundary, seeing metrics, logs and traces together helps you find where it started, not just where it surfaced.
Where they overlap
Both offer application monitoring, tracing, logs and replay or user-experience capabilities. Sentry is a natural shortlist for code-level debugging, while Datadog is a natural shortlist for correlated application and infrastructure investigations. These are starting points for evaluation, not hard product boundaries.
Side-by-side comparison
The free entry points are documented on the Sentry pricing page and Datadog pricing page. A limited infrastructure tier is not a free full-stack Datadog deployment. Check quotas, product access and retention before relying on either free plan.
Error tracking and performance: where the day-to-day differs
Imagine a checkout exception affecting a subset of Android users. With the relevant instrumentation, Sentry can group the issue and show stack traces, release context and sampled replays where supported and enabled. Reproducing and verifying the fix may still require work outside the monitoring tool.
Now imagine checkout is slow for everyone at 2 pm. The cause might be a saturated database host, a noisy neighbor on a shared node or a misconfigured autoscaler. That is Datadog territory: host metrics, container health and traces sit on the same timeline.
The pattern holds across most real incidents:
- Application bug, clear failure: evaluate Sentry's issue grouping and code context against a real debugging task.
- Slow system, no obvious exception: evaluate Datadog's infrastructure and dependency correlation against a representative incident.
- Both at once: you want both views, which is why integration matters.
Setup and workflow
An initial Sentry SDK installation can be small, but production setup also includes source maps or debug symbols, release tagging, privacy settings, sampling and alert tuning. Trial a real service and measure the time to a useful diagnosis rather than assuming a fixed setup time.
Datadog asks for more up front: deploying the Agent across hosts or clusters, enabling tracers per language, connecting AWS, Azure or Google Cloud accounts, and deciding what to index so costs stay predictable. The payoff is a shared operational picture, but it usually needs an owner, whether that is a platform engineer or a DevOps lead.
If nobody on your team owns infrastructure today, that is a signal. A tool that needs an owner and doesn't have one tends to end up half configured.
Pricing: what to expect
Both vendors publish prices in US dollars. Australian teams should expect currency conversion, and possibly GST, on top. Treat everything below as a snapshot and confirm on the vendors' pricing pages.
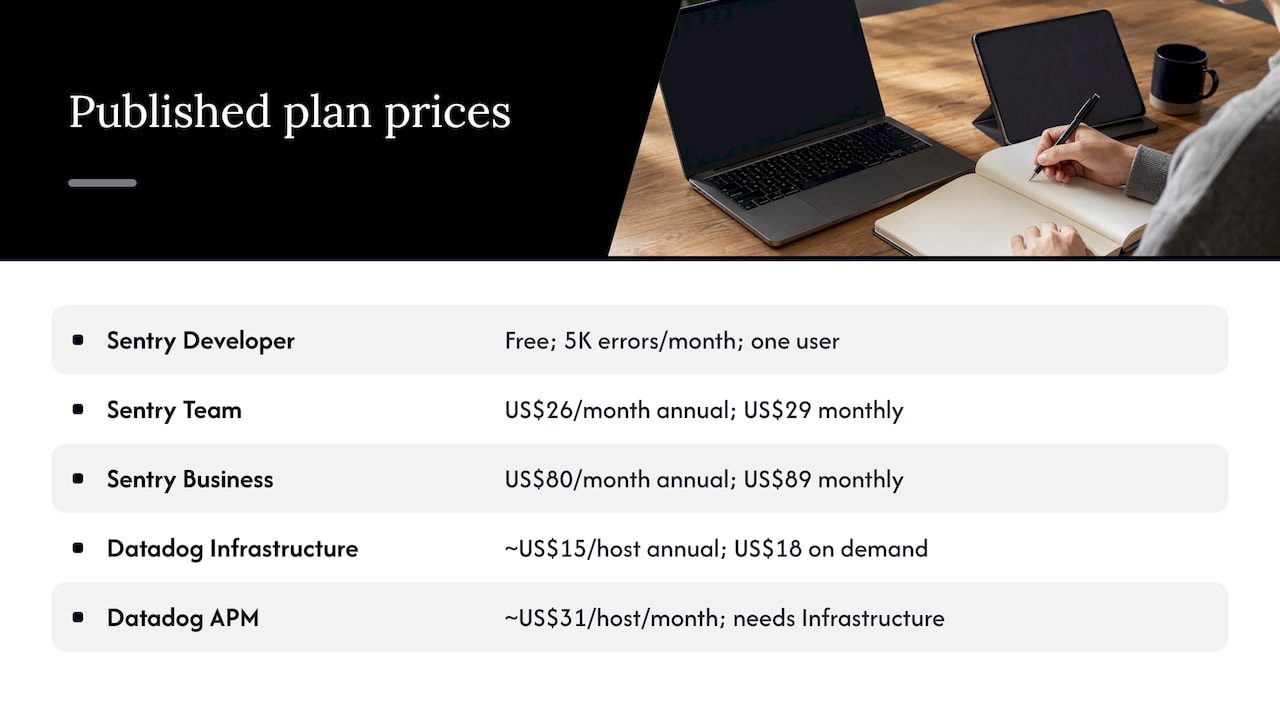
Sentry. The vendor pricing page lists a free Developer plan for one user with 5,000 errors per month. Team starts at US$26 per month and Business at US$80 per month when billed annually with default prepaid data; both list 50,000 included errors. These are starting configurations, not an all-inclusive bill. Check the calculator for logs, spans, replay, profiling and additional services at your expected usage.
Datadog. Its published price list lists Infrastructure Pro at US$15 per infrastructure host per month and APM at US$31 per APM host per month on annual billing. These are separate product rates, not a complete stack price. Logs, retained spans, custom metrics, replay and other products may add charges; serverless workloads use different units. Confirm required product combinations and contract terms in your quote.
Model the whole bill using the same workload. For Sentry, include each data quota and any paid add-ons. For Datadog, include billable hosts, selected products and usage such as logs and indexed spans. Host-based billing can use a high-watermark or a monthly/hourly commitment model under the billing documentation. Test alert noise, retention and sampling before forecasting a larger deployment.
When to choose Sentry, Datadog or both
Choose Sentry if
- You ship a web or mobile product and want bugs fixed quickly by the developers who wrote the code.
- Your infrastructure is managed (a platform host, serverless, a handful of services) and you don't have a dedicated ops function.
- You want session replay and error context in the same place as stack traces.
Choose Datadog if
- You run many services, containers or Kubernetes clusters, or span more than one cloud.
- Platform or SRE engineers need metrics, logs and traces correlated on one timeline.
- You need to watch infrastructure health, not only application behavior.
Run both if
- Your platform team needs Datadog's operational view and product developers prefer Sentry's issue workflow. Define which system owns each alert and how incidents are linked before paying for duplicate telemetry.
- You want to keep error triage developer-friendly while the operations team keeps its infrastructure dashboards.
Distinguish two routes. The Sentry integration guidance covers forwarding events using Sentry Internal Integrations and webhooks. The separate Sentry SDK intake guide points a supported SDK to a Datadog DSN, requires Error Tracking for Logs, and accepts events and messages rather than traces, attachments or sessions. Changing the DSN is a routing change, not automatic delivery to both vendors. Verify SDK compatibility, duplicate collection, billing and data handling in a pilot.
Existing stack and team expertise should guide the choice: Sentry suits application debugging, and Datadog suits broader cloud observability.
What to check before you commit
- Who will own it? Name the person who sets alerts, tunes noise and reviews the bill.
- What is your data? Review replay and log collection, masking, retention, access controls and hosting regions. Test with synthetic sensitive inputs. Assess the privacy obligations that apply to your business; product defaults alone do not establish compliance.
- What is your volume? Estimate monthly errors for Sentry, and host count plus log volume for Datadog, before reading any pricing page.
- Can you start free? Both have free entry points. Instrument one real service, not a demo.
- What happens at scale? Ask how costs move if traffic or hosts double.
Monitoring is half the story: what users actually do
Error and performance data can show failures, and both platforms can provide user-experience context when the relevant products are configured. It does not by itself establish which fix caused a conversion improvement. Pair technical investigation with behavioural analysis, research and a suitable test. Our guides to session replay tools for Australian teams, product analytics tools and page monitoring tools offer related evaluation questions.
If you're building a dashboard on top of this data, what top-performing SaaS dashboards have in common covers how the best ones present it.
Our perspective
We don't sell monitoring, so we have no horse in the Sentry vs Datadog race. What we see is the consequence of the choice. A team with great infrastructure dashboards and no view of what users experienced ships fixes that nobody can connect to results. A team with sharp error tracking and no research habit fixes bugs while the real friction sits in the flow.
Our view is that monitoring should feed design decisions. An error spike on a signup step is a research question: who hit it, what were they trying to do, and what did the screen make easy or hard? That is why we pair data and research with design, and why we run work as Design Sprints and RapidMVP builds, where a team validates an idea before it commits to the expensive version.
The best product teams we know treat reliability as part of the experience. When we work with a team on UX, conversion rate optimisation or an ongoing design team engagement, the monitoring stack is one of the first things we ask about, because it shows us where users are already struggling.
Philippe
Turn the data into better product decisions
If your monitoring shows users are stuck but you need help understanding the experience, explore our Full UX/CRO Audit, starting from $3,500 plus GST as a one-off, or UX/UI Design Team, starting from $8,400 per month plus GST. Confirm currency, scope and terms directly before booking. You can also start with our free UX audit or explore our conversion rate optimisation service.

Every engagement is built around research and testing rather than guesswork, so what you learn from tools like Sentry and Datadog turns into changes users can feel.