.svg)
.svg)



Usability metrics measure whether specified users can achieve specified goals with effectiveness, efficiency, and satisfaction, which is the exact framing ISO 9241-11 uses to define the concept. If we had to pick a starting point for any team, it would be three measures: task success rate, time on task, and a perceived usability score like SUS. The rest of this guide shows how to calculate each one, how to design a study that holds up to scrutiny, and how to turn raw numbers into decisions worth making.
What ISO 9241-11 Actually Asks Us to Measure
It is easy to treat "usability" as a vibe: something feels clunky, or it feels smooth. ISO 9241-11 refuses that vagueness. The standard defines usability as the extent to which specified users can achieve specified goals with effectiveness, efficiency, and satisfaction in a specified context of use. Four variables, really: who is using it, what they're trying to do, how well they do it, and under what conditions.
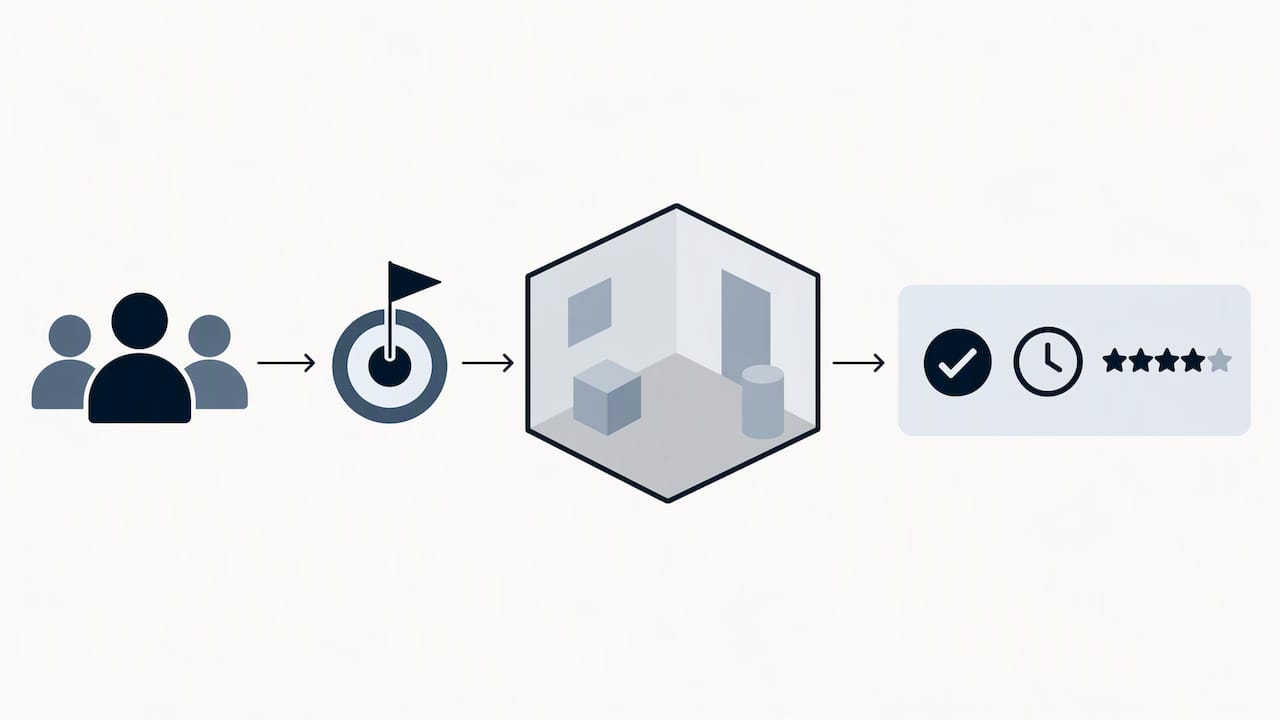
That last part, context of use, is the piece teams skip most often. A banking app tested by calm users on a laptop in a quiet office will perform differently than the same app used by a stressed commuter on a cracked phone screen with one hand. The metrics don't change, but the numbers they produce absolutely will.
Picture a simple scenario: a user needs to reset a forgotten password on an e-commerce site.
- Effectiveness asks whether they completed the reset at all.
- Efficiency asks how long it took and how many steps were wasted.
- Satisfaction asks how the experience felt, frustrating, fine, or genuinely pleasant.
Every metric in this guide maps back to one of those three outcomes. If a number you're tracking doesn't obviously connect to effectiveness, efficiency, or satisfaction, it's worth asking why you're tracking it.

Core Usability Metrics: Definitions, Formulas, and Use Cases
Once the ISO framing is in place, the next question is practical: which numbers do we actually calculate? Here's a working catalog, organized roughly from "what happened" to "how it felt."
- Completion rate (task success). The simplest formula is successful completions divided by total attempts, expressed as a percentage. Binary scoring (pass or fail) is easiest to analyze, but partial-credit scoring, where a task is scored 0, 0.5, or 1 depending on how close the user got, captures more nuance for complex, multi-step flows.
- Error rate. Count errors per task attempt, but separate critical errors (the user fails or gives up) from non-critical ones (the user recovers without help). Lumping them together hides the difference between a rough edge and a broken flow.
- Time on task. Report the median rather than the mean, since task times are almost always right-skewed, with a few users taking far longer than the rest. A trimmed mean (dropping the top and bottom 5 to 10 percent) is a reasonable middle ground when you need a single summary number for a report.
- Task efficiency. Often expressed as completion rate divided by average time, or as the number of steps or clicks taken versus the minimum possible. Interaction cost metrics, like clicks-to-goal, are useful proxies when direct timing isn't available, as in some analytics setups.
- Perceived usability scores. The System Usability Scale is a 10 item questionnaire producing a composite score from 0 to 100. A score above 68 is generally considered above average, based on an aggregate across hundreds of studies using the measure. UMUX and its shorter variant, UMUX-LITE, are compact alternatives that correlate well with SUS, which the original UMUX research demonstrates directly, and they're worth using when survey length is a constraint, with UMUX-LITE scores adjustable via regression to approximate SUS norms. The Single Ease Question (SEQ), a one-item "how difficult was that task" rating, is the lightest-weight option for per-task feedback.
- Engagement and in-product proxies. Session length, feature adoption, and return visits can hint at usability problems, but they're behavioral signals first. A long session might mean deep engagement or it might mean the user got lost. Treat these as supporting evidence, never as a substitute for direct measurement.
A score above 68 on the System Usability Scale is commonly treated as above average, based on an aggregate of hundreds of studies. That one number gives teams a shorthand for comparing their product against a broad industry baseline, though it's a starting point for interpretation, not a pass or fail line.
How to Measure: Moderated, Remote, Unmoderated, and Analytics Approaches
Choosing a test format is really choosing what kind of noise you're willing to tolerate in exchange for what kind of depth.
Moderated lab testing, where a researcher sits with the participant, gives the richest observational data: hesitations, confused expressions, the moment someone almost gives up and then doesn't. It's also the most resource-intensive option, and the presence of a moderator can itself change behavior slightly.
Remote moderated testing keeps the researcher in the loop over video while removing the need for a physical room, which widens the pool of people you can recruit. Unmoderated, self-paced testing trades that observational richness for scale: more participants, faster turnaround, lower cost per session, but less ability to probe a confusing moment in real time.
In-product analytics sits apart from both. Rather than a scheduled session, it's a continuous stream of behavior from real users in real conditions. For this to be useful, instrument clearly:
- Event tracking on key actions (button clicks, form submissions, feature use).
- Funnel steps that show where users drop off between intent and completion.
- Timestamps precise enough to calculate time on task without manual stopwatching.
Pair objective task outcomes with subjective ratings at the appropriate level. Collect SEQ after each task, and use SUS or UMUX-LITE after participants have experienced the system or completed the study. Compare task evidence with overall perceived usability; disagreement can identify questions to investigate rather than proving a cause.
Pro Tip: UMUX has four items; UMUX-LITE has two. Use a validated questionnaire and its matching scoring method when survey length is constrained. SEQ is a separate one-item measure for post-task ease ratings. UMUX-LITE guidance
Designing Studies: Sample Sizes, Tasks, and Experimental Design
A usability study is only as credible as its design, and the design decisions that matter most are task selection, sample size, and how you handle repeated exposure.
- Choose realistic tasks. A task framed as "find the return policy" tests something different than "you ordered the wrong size, fix it." The second gives the user a goal, which is what ISO 9241-11 asks for in the first place.
- Size the study to the question. Small iterative groups can reveal usability problems, but they do not establish precise population rates or guarantee that most issues will be found. Formal comparisons require a power calculation based on the target difference, variability, test design, significance level, and power. Do not treat 178 participants as a universal requirement for detecting a 7.5-point SUS difference. Study-size guidance
- Decide between-subjects or within-subjects. Between-subjects designs (different people see different versions) avoid learning effects but need more participants. Within-subjects designs (the same people try both versions) need fewer people but require randomizing or counterbalancing the order to prevent the first version from always looking better or worse just because it came first.
- Watch for learning effects. Familiarity with an earlier task can affect a later one. Randomisation or counterbalancing can reduce order bias, but does not guarantee that learning or carryover effects disappear. Document the sequence and use an analysis suited to repeated observations.
Getting this part right up front saves a lot of regret during analysis, when it's too late to add more participants.
Analysis and Interpretation: From Raw Numbers to Defensible Claims
Before running any statistical test, look at the data. Plot the distribution of task times, check for outliers, and glance at a boxplot of SUS scores across conditions. A single participant who took ten times longer than everyone else can quietly wreck a mean, and a visual check catches that before it corrupts a report.
For formal comparisons:
- Parametric tests (t-tests) work when sample sizes are reasonable and distributions aren't badly skewed.
- Nonparametric alternatives such as Mann-Whitney U or Wilcoxon can be useful when their assumptions and target comparison match the data. They are not automatically superior for every small sample, and their results should not be described as a difference in means without justification.
- Effect sizes and confidence intervals matter more than a bare p-value, since statistical significance doesn't tell you whether a difference is big enough to matter for the product.
- Small-sample SUS intervals need care. The cited study proposes decision rules using an expanded BCa method and, for extremely small samples, an empirical Bayesian approach. It does not endorse ordinary BCa intervals for every bounded metric or sample of ten or fewer. Report the estimator, interval method, assumptions, and uncertainty; bootstrapping cannot compensate for unrepresentative recruitment. Small-sample SUS study
A meta-analysis found that SUS correlates strongly with perceived workload, as measured by instruments like NASA-TLX, but only moderately with objective measures like task time and error rate. That gap is worth sitting with. It means a product can feel effortless to a user (high SUS, low workload) while still producing measurable friction in task completion, and the reverse can happen too. Subjective and objective metrics are complementary, not interchangeable, and a report that only includes one side of that pair is telling half the story.
Reporting Results and Translating Metrics into Product Decisions
Visualization choices matter here. Success-rate bars with confidence intervals show both the result and its uncertainty at a glance. Time-on-task boxplots reveal skew that a single average would hide. SUS tracked over multiple releases, as a trend line, shows whether changes are actually moving perceived usability or just shuffling it within noise, a practice covered in more depth in our piece on tracking UX metrics over time.
Pro Tip:Export raw task-level data alongside the summary report so design and engineering teams can re-slice results by user segment without waiting for a follow-up study.
How We Build Usability Measurement into Client Work
In our own Design Sprint and RapidMVP cycles, we embed task success rate, SEQ ratings, and a post-sprint SUS check at nearly every validation checkpoint, pairing those with in-product analytics once a build ships. The goal is always the same: catch friction before launch rather than after, and tie design decisions to measured outcomes instead of opinion. We've seen that discipline translate into real conversion gains for clients, including a documented case where a redesign doubled conversion rate.
Where Metrics Help and Where They Get in the Way
Metrics earn their keep once a feature is mature enough to measure, or right before launch, when a number can validate or kill a decision. Early discovery is different territory entirely: a SUS score can't tell you why a user hesitated, only that they did. We scale measurement up as a product matures, not before.
Get Hands-On Help Measuring and Improving Usability
If reading formulas is one thing and running a defensible study under deadline is another, that's exactly where our Full UX/CRO Audit earns its place, pairing task-level metrics with a structured CRO review.
For teams that want this built into an ongoing cadence rather than a one-off project, our Design Team (Platinum) plan keeps SUS, task success, and analytics review running alongside your roadmap. Start with a free UX audit to see where your current numbers stand.