



Cohort analysis groups your users by a shared starting point, such as the month they signed up, and then tracks each group over time instead of blending everyone into one average. That single change shows you whether your product, onboarding or pricing is actually getting better for new customers, which an overall retention number cannot tell you. This guide explains how to choose cohorts, build a retention table, read it, and turn what you see into design and conversion decisions.
What cohort analysis actually is
A cohort is a group of people who share a common experience in the same time window. In GoCardless's Australian guide, it is a group of users who experience a common event within the same period, typically the month they were acquired. Cohort analysis is the habit of following each of those groups over time rather than lumping every user into one dataset.
Stripe's Australian guide puts the practical value plainly: it reveals patterns buried in aggregate data, such as new customers leaving quickly while older cohorts keep the blended retention figure afloat.
Think of it as the difference between a weather average for the year and a forecast for each week. The average is true. It is also useless when you need to know whether last month's change worked.
Cohorts versus segments
The two terms get mixed up. A segment is a snapshot of people who share a trait, such as "high-value shoppers" or "customers on the annual plan". A cohort is defined by when they started, and its membership is fixed. According to GoCardless, cohort analysis is time-bound and segmentation is not, and the two work best together: segments sit inside cohorts. For example, you can take your June sign-ups and then split them by acquisition channel to see which source produced customers who stayed.
Why a blended average misleads you
Imagine your overall retention sits steady for six months. It looks like nothing is happening. Shopify's cohort retention guide shows how this can fool you: a store can report a stable 30% overall retention while cohort analysis reveals that customers acquired two years ago retain at 70% and last month's new users at 90%. The flat line was an average of two very different stories.

The same trap works in the other direction. When you grow quickly, you add lots of brand-new customers, who always churn faster than established ones. The blended number can fall even though the product improved. Cohorts remove that mix effect because each group is measured at its own age.
For a startup validating a new product, this is the whole point. You are not asking "what is our retention?" You are asking "did the thing we changed in March make the people who joined after March stick around longer?" Only cohorts can answer that.
Choosing cohorts, metrics and time windows
The textbook structure has three parts: the cohort grouping, a time series of data, and an aggregate metric. The academic cohort analysis chapter states these three components and gives one rule that saves a lot of confusion: measure elapsed periods from each customer's start date, not calendar months, so cohorts can be compared at period 1, period 2 and so on.
Pick the cohort that matches your question
- Acquisition cohorts (sign-up month or week) show whether retention trends are improving over time.
- Behavioral cohorts (people who completed onboarding, or used a particular feature) help explain why some users stay.
- Channel or plan cohorts compare business dimensions, such as paid search against referrals.
Start with acquisition cohorts. They are the simplest and the easiest to explain to a board.
Pick one metric
Choose the single metric that answers the question you actually have. For SaaS, EVP's Australian SaaS metrics guide says the most common cohort metrics are subscription revenue (revenue retention) and account count (logo retention), with engagement measures such as logins as alternatives. For an online store, the equivalent is the share of a cohort that places a second order.
At the simplest, retention rate is the number of users from the cohort who are active in a given period, divided by the number in the cohort at the start, multiplied by 100.
Pick a sensible time window
Match the window to how often people naturally use the product. A daily-use app can be read in days. A B2B tool that people open weekly is better read in weeks or months. EVP recommends monthly cohorts for SaaS because they age consistently, so what you see at months 6, 8 and 12 is comparable. Quarterly or annual cohorts can help when you need larger sample sizes.
Sample size matters more than most teams expect. A cohort of a few dozen people will swing wildly from one period to the next. If your cohorts are tiny, widen the window (use quarters instead of months) before you draw conclusions.
How to build a retention cohort table
You can build one in a spreadsheet, a SQL query or most analytics tools. The logic is the same everywhere.
- Define the starting event. Sign-up, first purchase or first activation. Pick one and stick with it.
- Assign every user to a cohort by the period in which that event happened.
- Define "active". A login is easy to measure but weak. A key value action (sent an invoice, completed a project, placed a repeat order) tells you far more.
- Count active users per cohort for each period after the start. Period 0 is the starting period itself.
- Divide each count by the cohort's period 0 size. Period 0 will always be 100%.
- Shade the cells. Colors make drop-offs visible in seconds.
Two cautions at this stage. First, the time series must cover customers' full life span. The academic chapter warns that otherwise survivorship bias can make the remaining customers look higher quality than newer cohorts. Second, pick one method of calculation and keep it. GrowPanel's guide notes there is no industry standard and that the same data can give a positive or negative net dollar retention figure depending on how you average it, so consistency matters more than which method you choose.
How to read the table
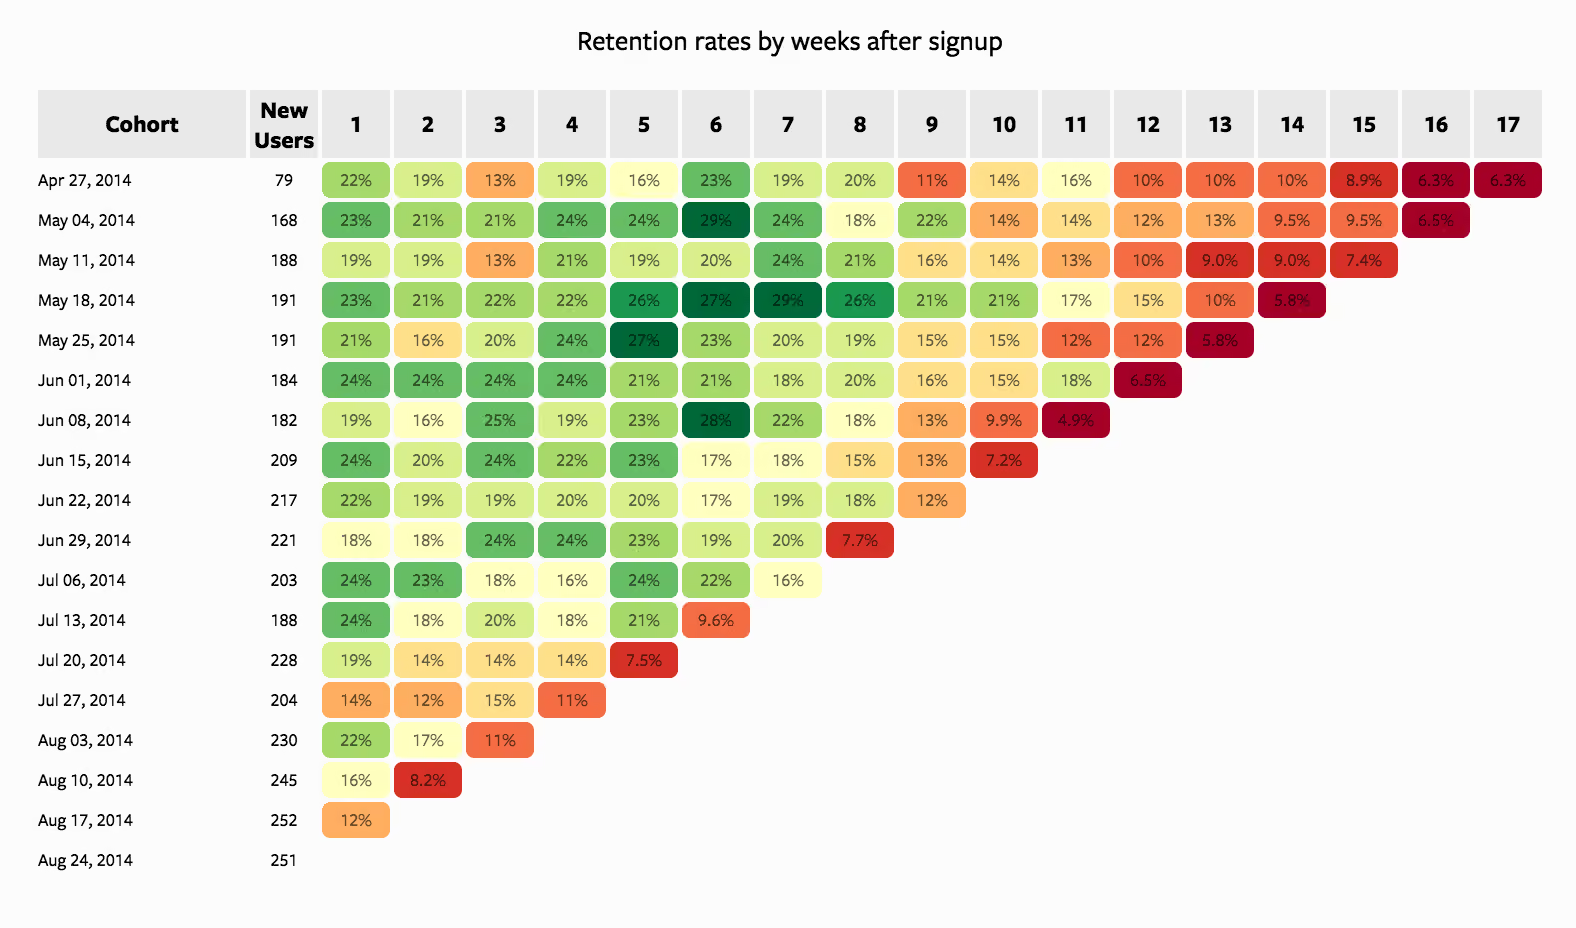
The table is triangular. Each row is a cohort, each column is the cohort's age, and the cells on the lower right are blank because recent cohorts have not lived long enough to fill them. EVP describes the standard layout: rows group by the month each cohort joined, the top axis shows lifetime, and colors mark good or bad performance.
A simplified illustration (the numbers are invented to show the layout, not real data):
Read across a row
Reading left to right shows how one cohort ages. The January row loses more than half of its people in the first month, then declines more slowly. That early cliff is usually where the biggest opportunity lives, because the drop between two intervals is where something in onboarding, expectations or value delivery is failing.
Read down a column
Reading top to bottom at the same age shows whether newer cohorts are better. In the illustration, month 1 climbs from 42% to 46% to 50%. That is a trend worth investigating: what shipped between January and March?
The rule is to compare cohorts at the same age only. Board Infinity's retention triangle guide makes the point with an edtech example: a January cohort of 1,000 users had 420 active in month 1 (42%), 310 in month 2 (31%) and 280 in month 3 (28%). Comparing a later cohort's month 1 with January's month 3 would be meaningless. Compare month 1 with month 1.
Watch the diagonal
The diagonal shows the same calendar month across cohorts. If every cohort dips in the same month, the cause is probably seasonality, an outage or a campaign rather than anything about the cohort itself. Stripe advises marking charts with product launches, campaign dates and known disruptions for exactly this reason.
Recognize the common curve shapes
- Steep drop, then a plateau. Some customers find value and stay. This is the healthy shape, and the job is to move the plateau higher.
- Steady decline with no plateau. Customers never settle in. That usually points at activation: the first experience is not showing people why the product matters.
- A cliff at a renewal point. For annual plans, churn that bunches around month 12 is a renewal experience problem.
Cohort analysis examples worth learning from
Spotting a market that is slower than the average says
EVP reports an Australian example: a portfolio company's blended customer acquisition cost payback was around 16 months. Splitting cohorts by geography showed Australia took more than 24 months to recover acquisition costs, against a faster payback in the more mature New Zealand market. The aggregate had masked the problem.
Finding the real story behind a healthy-looking number
The Shopify example above is the classic case. A flat 30% overall figure concealed two very different groups. The lesson is not that the number was wrong. It is that you cannot decide what to fix until you see which group is moving.
Pairing cohorts with segments
Shopify also shows combining cohorts with RFM segmentation (recency, frequency, monetary value, a way of scoring customers by how recently and how often they buy and how much they spend). You can track how many people from a top "June cohort" move into a "champions" segment, which turns a retention table into a picture of customer quality.
A product-design example
Here is how this plays out for a design team, as a hypothetical. Suppose month-1 retention is weak for everyone who signed up in a particular quarter. You split that cohort by whether people finished onboarding. If the finishers retain far better, you have a hypothesis: the onboarding steps matter, so simplify them, test the new flow, and watch whether the next cohort's month 1 improves. That is how cohort analysis feeds UX decisions. It points to the moment in the journey worth redesigning. For a deeper look at the product side, see our piece on reducing SaaS churn through billing and onboarding.
What cohort analysis cannot tell you
Cohort tables show what happened and when. They do not prove why.
The academic chapter is direct on this: A/B tests are the gold standard for causality, and cohort analysis should be used to understand customers and generate hypotheses to test rigorously. Stripe gives the same advice and suggests pairing cohort patterns with qualitative insight or experiments.
In practice, that means three habits:
- Write the hypothesis down before you change anything: "If we shorten onboarding from six steps to three, month-1 retention for the next cohort should rise."
- Run a controlled test where you can. Our guide to A/B testing for founders walks through how to set up experiments that move revenue.
- Talk to users from the cohort that behaved differently. Numbers show the cliff. Interviews show what people were thinking at the edge of it.
Also remember that recent cohorts are incomplete by definition. A group acquired eight weeks ago cannot yet show month-3 behavior, so do not judge it against older groups.
From insight to action: improving retention and conversion
Once you can read the table, the work is deciding what to change. A reasonable order of attack:
- Find the steepest drop. The interval where the most people leave is the highest-leverage place to intervene.
- Look for outlier cohorts. One row that is noticeably better or worse than its neighbors is a natural experiment. What was different about that month: a campaign, a release, a pricing change?
- Check the trend in a column. If successive cohorts are improving at the same age, your recent changes are working. If they are slipping, something has regressed.
- Slice by channel and by behavior. Linking retention to the acquisition source exposes channels that bring in short-lived traffic, and linking it to feature use shows what keeps people.
- Redesign the friction point, then measure the next cohort.
Many of the fixes sit in the experience itself: a confusing first-run screen, a dashboard that buries the key action, a checkout that asks too much. Our write-ups on UX mistakes that kill SaaS conversion and what top-performing dashboards have in common cover patterns that commonly show up as early cohort drop-offs.
Which tools to use
A spreadsheet is enough to begin with, as long as you can export sign-up dates and an activity event per user. Most analytics platforms and subscription billing systems also produce cohort tables automatically. The tool matters less than the discipline: a clear starting event, one metric, fixed time windows and a written hypothesis. If you are weighing up the wider testing and optimization toolkit, our guide to conversion rate optimisation tools lays it out.
Where we come in
Cohort analysis tells you where people leave. Fixing it is a design and research problem, and that is the work we do at Raw Studio in Sydney. Our services include conversion rate optimisation, user research and Data Intelligence, which sit naturally behind a cohort finding.
If you have a retention cliff and want a clear view of the experience behind it, our Full UX/CRO Audit starts from $2,500 as a one-off. If you would rather have ongoing support, the Design Team (Platinum) plan is $8,400 per month. Both are on our pricing page, and you can also start with a free UX audit.

For teams that need to validate a new idea before committing to a build, our Design Sprint and RapidMVP engagements are built for exactly that kind of question. Details are on our services page.
Our perspective
Most teams we talk to already have the data for a cohort analysis. What they lack is a habit of asking the cohort question before they redesign something.
We care about it because every design decision is a bet about behavior. A cohort table is the cheapest way to see whether last quarter's bet paid off for the people who arrived after it. It turns an argument about taste into a question about evidence.
Our approach is research-driven: we want the numbers to tell us where to look, and users to tell us why. A retention cliff in month 1 points us to the onboarding journey. A flat plateau at a low level points us to the core value of the product. In both cases, the next step is a hypothesis, a design change and a fresh cohort to measure it against.
That is why we pair analytics with user research and testing, rather than treating a chart as the answer. The chart is where the conversation starts.
Sources
- Cohort analysis for businesses: Here's what to know | Stripe
- What Is Cohort Analysis? | GoCardless
- Cohort Retention Analysis: How to Reduce Churn | Shopify
- Cohorts, the original chapter | Cohort analysis
- Desk Notes on SaaS Metrics: Cohort Analysis | EVP
- SaaS Cohort Analysis: Retention and Revenue Cohorts | GrowPanel
- Retention Cohort Analysis: Read the Triangle | Board Infinity
Recommended
- How Netflix Uses 4 Personalization Tactics to Increase Retention Revenue by $1B and Conversion Rate by 15%
- Reducing Churn with Good Customer Cancellation
- First Impressions Matter: Crafting Compelling User Onboarding Experiences