Data Analytics in Design: 4 Great Approaches from Airbnb, Netflix, Amazon and Spotify
From personalising a user’s experience to mitigating risk, data analytics are invaluable when making big business decisions that lead to product innovation. Organisations are increasingly reaping the rewards of data and design, realising just what a wicked combo the two are when paired together, rather than just coexisting.
As mentioned in one of our previous articles, customer data has become something of a currency, with many users consenting to this unknowingly or without concern, whilst others are a little more sceptical. But generally, people are much more likely to share their data if there is a clear exchange of value.
Below we’ll jump into a few well-known names and how they bring this value, embracing the expansive capabilities that a data & design collaboration can bring.
Table of Contents
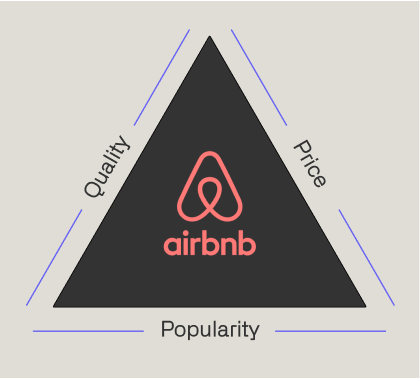
Airbnb helps you find an ideal stay 🏡
Airbnb doesn’t really need much of an introduction as the world-renowned online marketplace for short-term stays. The term marketplace incurs a two-sided interaction, in Airbnb’s case this is an intermediary (marketplace) that facilitates transactions between two sides: hosts (supply) and guests (demand). Guests want their needs matched within just a few clicks and hosts want their listings to be as visible and as top-ranked as possible, resulting in more $$$.
To get more bookings for hosts and more tailored results for users, Airbnb brings up the most suitable listings through data in a few ways:
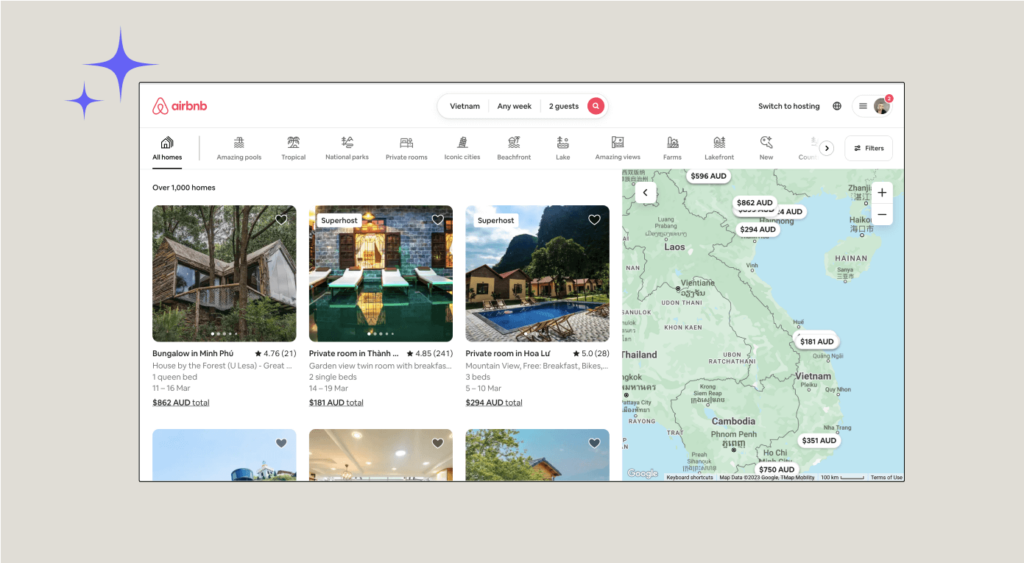
👀 User search history: Airbnb analyses user search history to understand what types of accommodations and locations users are interested in. This then helps them personalise search results for each user by presenting listings that are more likely to match their preferences, in turn resulting in more tailored results.
⭐️ User ratings and reviews: Airbnb uses data analytics to evaluate user ratings and reviews of accommodations to inform search results. Listings with higher ratings and more positive reviews are far more likely to appear at the top of search results. It’s a win-win for both guest and host, as it incentivises / rewards guests who provide quality stays.
📍 Location-based data: This will present search results based on a user’s current location or desired location. This includes analysing user IP addresses and GPS data.
🧹 Filter usage: This action is assessed by Airbnb so that they can understand which filters are most commonly used by users. This helps them optimize their filter options to ensure that users can easily find what they’re looking for.
🔮 Predictive analytics: Predictive analysis is a branch of data analytics that uses statistical algorithms and machine learning techniques to analyse historical data and make predictions about future events or behaviours. Airbnb uses this to anticipate a user’s search criteria and preferences. This includes analysing user behaviour, such as past searches and bookings, to predict future search criteria and present more relevant results.
🌏 A nice example
AirBnB conducted a study in 2014 and discovered that customers from certain Asian countries had a higher bounce rate when they landed on the home page, with many churning and leaving the website without making a booking. Upon further data analysis, AirBnB determined that the “Neighborhood” link and the accompanying photos were distracting users, who would then abandon the booking process and not return.
As a result, the data science team at AirBnB redesigned the algorithm, removing the “Neighborhood” link for visitors from Asian countries and instead showcasing Top Traveling Destinations in Singapore, China, Japan, and Korea. This change had a significant impact, with Asian visitor conversion rates increasing by 10%.
By embracing data as the invaluable voice of the customer, Airbnb can continuously optimise its user experience and abundance of features. AirBnB’s experience offers valuable insights into the importance of leveraging big data as a tool for understanding customer needs and preferences.
If you’re keen to read a little bit more about Airbnb, check out our article where we discussed their post-pandemic feature releases.
Netflix supplies bespoke recommendations 💻
For those (like me) with ever-present decision fatigue, it feels like Netflix holds your hand and points you in the right direction when it comes to a post-work TV or movie binge. The soothing words of ‘Top picks for you’ and ‘Because you watched x show’ take the brunt of the decision-making.
These tailored recs are not just coincidence, of course. Netflix is a company that has revolutionised the way we watch TV shows and movies. One of the ways they have done this is by providing users with personalised recommendations based on their viewing history. To achieve this, Netflix utilises data analytics to check the behaviour of their users, allowing them to provide recommendations that are tailored to an individual user’s preferences.
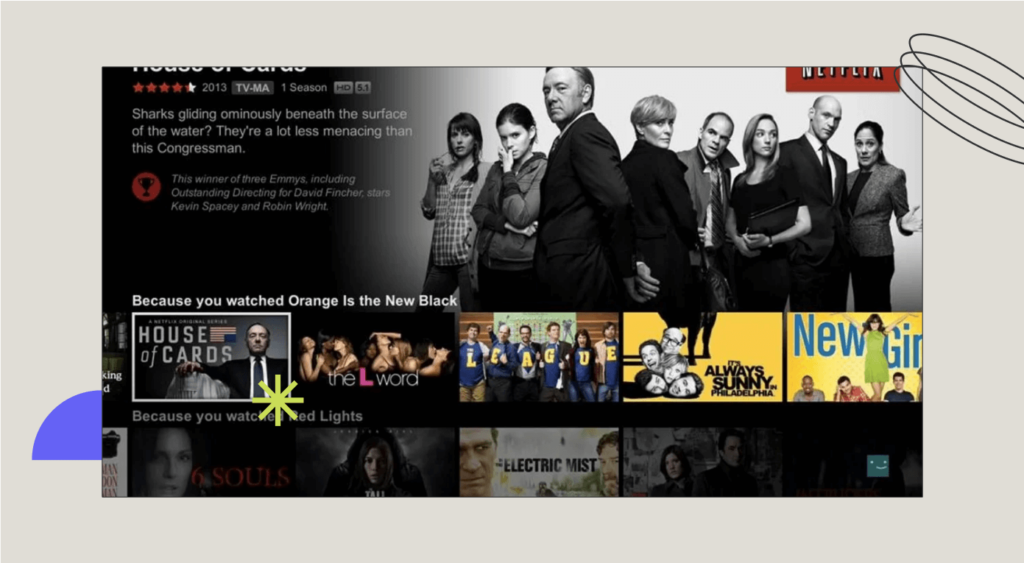
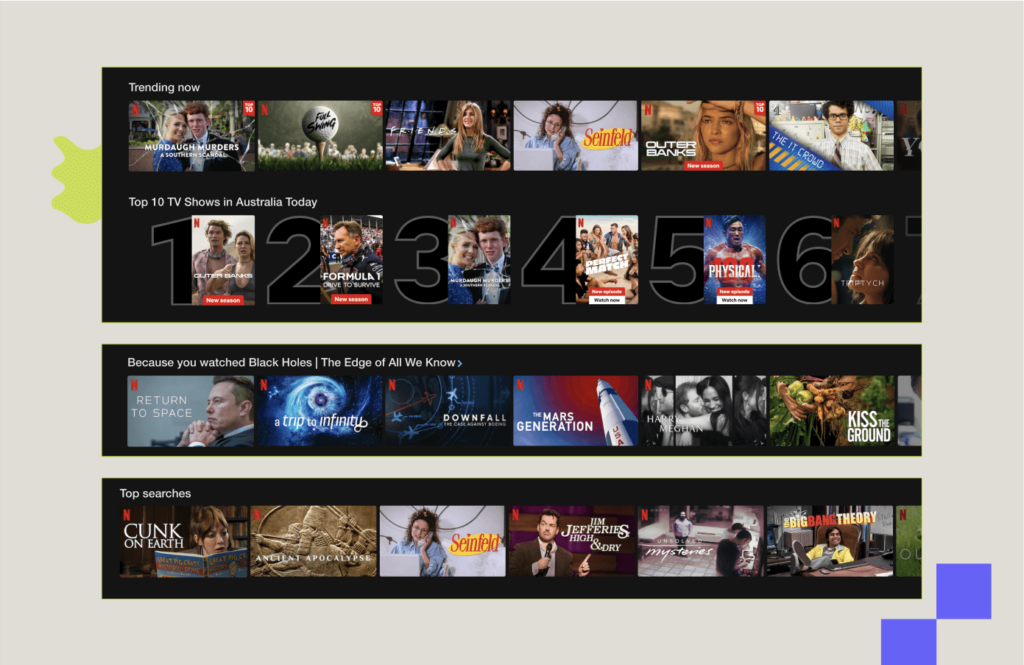
📚 Analysis of user viewing history: You’re tracked on what you watch when you watch, and how often you watch. This data is used to develop algorithms that predict what a user might be interested in watching next based on their viewing history, a.k.a ‘Top picks for you’ and ‘Because you watched x show.’
✨ User interactions: Netflix tracks how users interact with the platform, such as how often they pause or rewind a show, and how quickly they stop watching a show. This information is used to determine how engaged a user is with a particular show and whether or not they are likely to continue watching it.
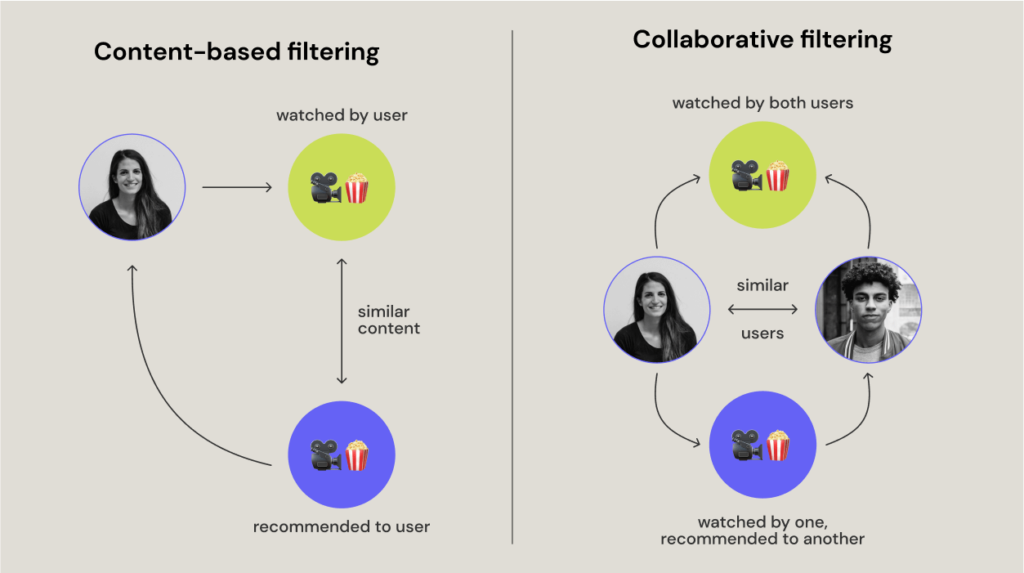
🤝 Collaborative filtering: This type of filtering is used to recommend content to users based on the preferences of similar users. This involves analysing (if you had a dollar for every time analyse was used in this article 👀) the viewing history of a group of users with similar preferences and recommending content to each individual based on what the group as a whole likes.
Unlike content-based filtering, as the title alludes to – is a collaborative process that expands a user’s range of recommended shows. It also feels a little more human knowing someone else who likes your style of shows liked this one, rather than a robot. In this case, the ‘robot’ is merely facilitating.
And how are these personalised recommendations received by users? Well, according to Netflix, over 75% of viewer activity is based off personalised recommendations (that’s quite a bit!)
It is evident that Netflix has successfully leveraged the power of data analytics to create a great user experience. By using data to inform their product design decisions, Netflix has been able to deliver personalised recommendations and an optimised. Through a data-driven approach, Netflix has been able to stay ahead of the curve and continuously improve its platform, solidifying its position as a leader in the streaming industry.
Amazon implements dynamic pricing and recommendations 🛍️
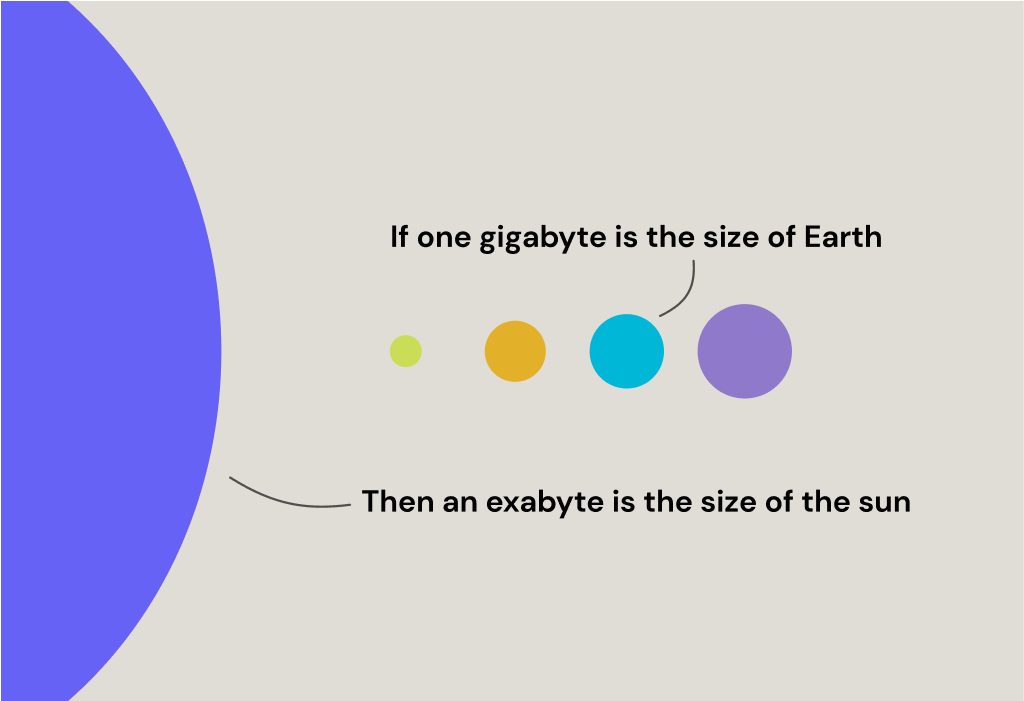
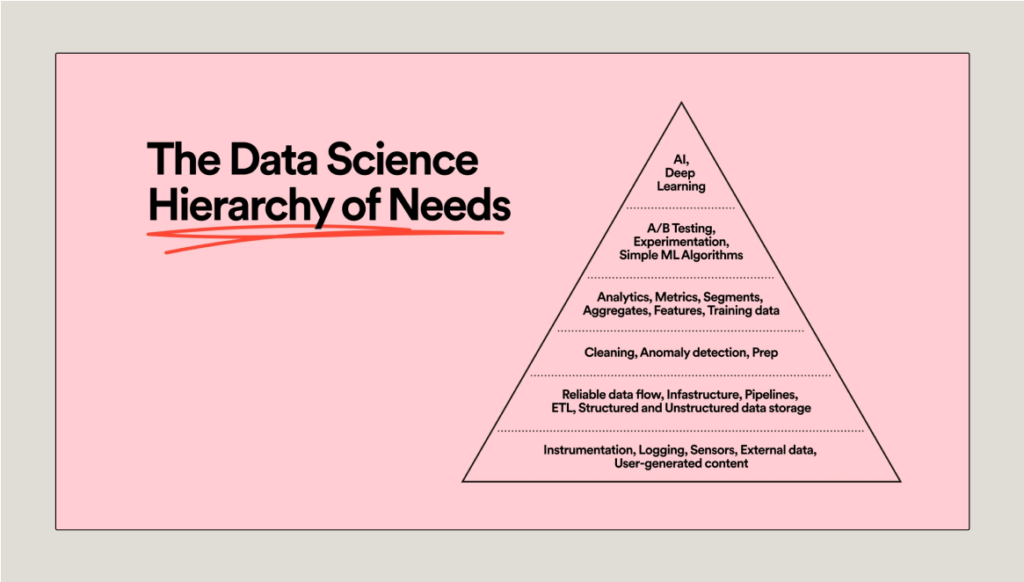
Amazon is no stranger to big data, collecting around 1 exabyte of purchase history data from their consumer base. If you are like me and are wondering “How big is an exabyte?” well take a look below:
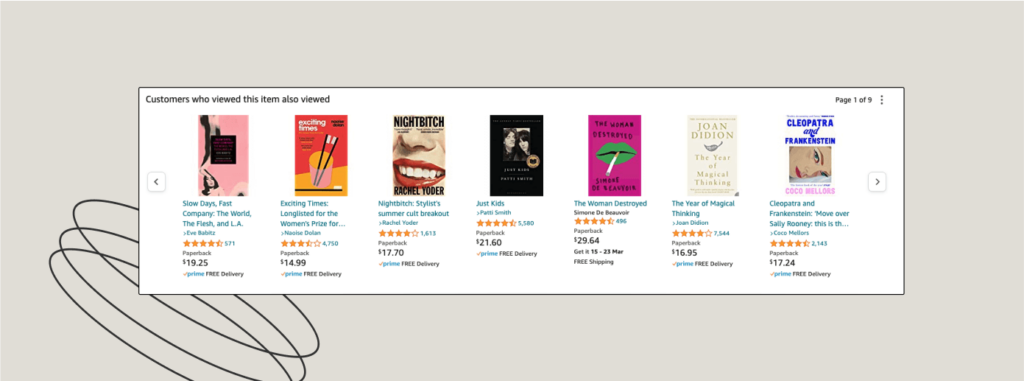
👋 “Customers Who Viewed This Item Also Viewed:” Amazon assesses past purchases and recommends complementary products to customers. By doing this, Amazon not only helps customers find products they may not have otherwise found, but it also encourages customers to make additional purchases, increasing revenue for the company.
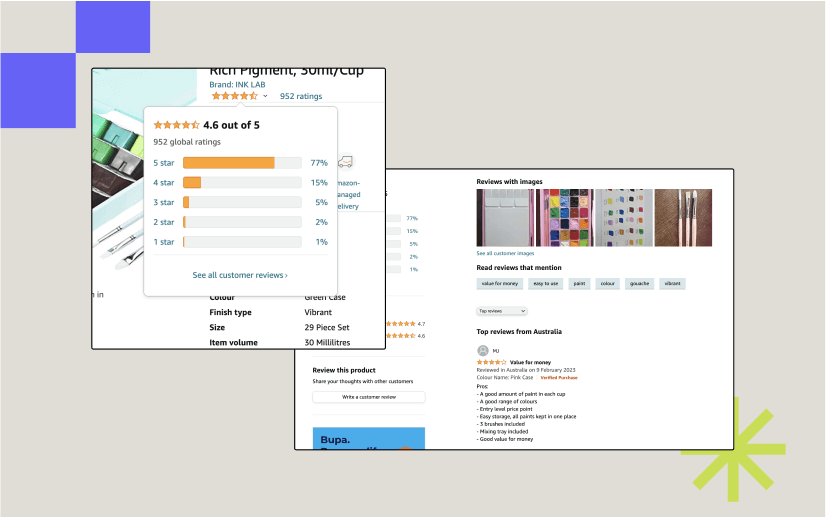
⭐️ Reviews: By doing so, they can identify trends and patterns in customer feedback and use that information to improve their products. For example, if a product receives many negative reviews due to a specific issue, Amazon can use that feedback to make design changes that address the problem and improve the overall user experience.
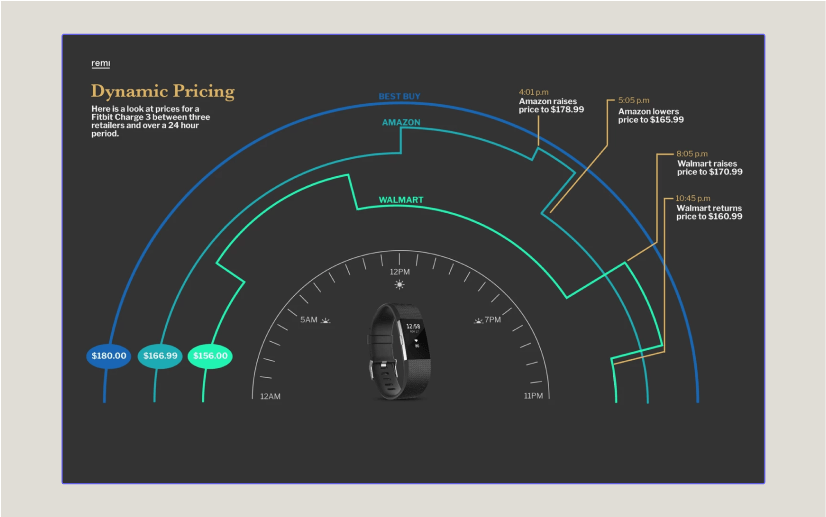
⚖️ Dynamic pricing: Amazon is well known for its dynamic pricing strategy, which adjusts the prices of products in real-time based on various factors such as demand, supply, competitor pricing, and customer behaviour. Amazon uses data analytics extensively to inform their dynamic pricing decisions and ensure that they remain competitive while maximising its profits.
- Real-time price tracking: tracking prices of competitors in real-time. Amazon uses sophisticated algorithms to scrape pricing information from competitor websites and marketplaces.
- Customer segmentation: customers are segmented based on factors such as purchase history, browsing behaviour, and location. This information is used to personalise pricing for each customer segment.
- Demand forecasting: this allows Amazon to adjust prices in real time based on predicted demand.
- Seasonal pricing: Amazon adjusts its prices seasonally based on past sales trends. For example, during the holiday season, Amazon may increase prices for certain products due to high demand.
- A/B testing: Amazon conducts A/B testing to determine the optimal price for each product. It tests different prices on a small group of customers and uses analytics to determine which price generates the most attention and revenue.
With pricing changing on average every 10 minutes, the embracement of big data allowed Amazon to increase their annual income by 143% from 2016 to 2019.
As Amazon continues to collect and analyse massive amounts of data, it will be interesting to see how they continue to use this information to innovate and improve its business practices and customer experience.
Spotify knows you a little too well 🎧
As I type this sentence, I’m blasting my personalised Spotify ‘Discover Weekly’ playlist through my AirPods (not sponsored.) With a user base that has almost doubled since 2017, Spotify is no stranger to big data, utilising it as a means to create a meaningful, emotional experience for its users.
We delved into this a little bit in our article on how Spotify embodies emotional design.
🎧 Listening habits
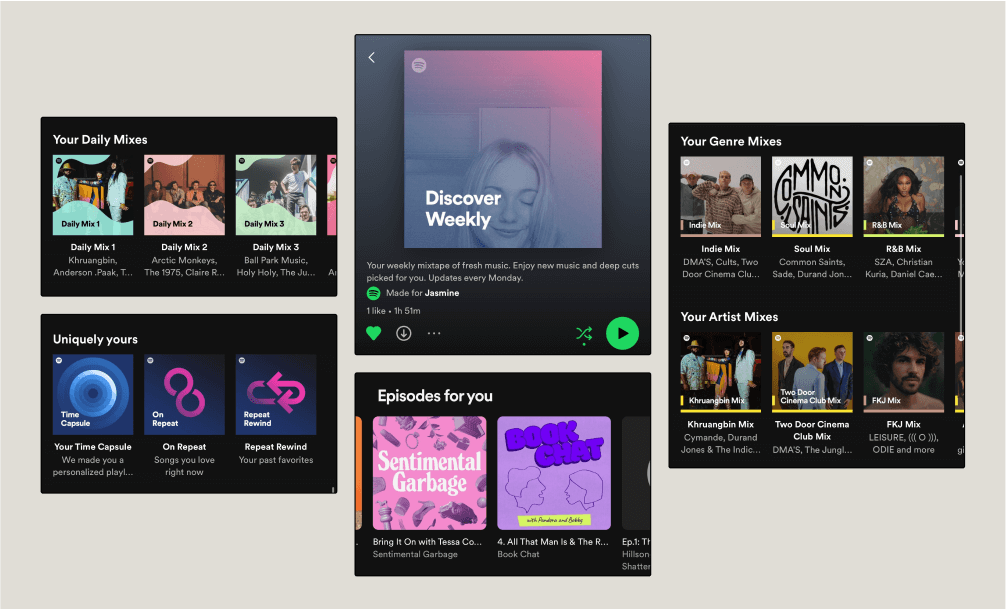
Spotify is known for its personalised playlists, which are curated based on user preferences and listening habits. Some examples of personalised playlists that Spotify puts together include:
- Discover Weekly: a playlist featuring new songs and artists that the user may not have heard before but are likely to enjoy based on their listening history.
- Daily Mix: Spotify creates up to six Daily Mix playlists for each user, which features a mix of old favourites and new discoveries based on the user’s listening history. According to Spotify, this playlist is made using “clustering technology to identify distinct subgroupings within our users’ listening patterns, and then build recommendations around those, mixing in appropriate new suggestions along with the known favourites.”
- Release Radar: This is a playlist of new releases from the user’s favourite artists or artists that they have listened to recently.
- On Repeat: This playlist features songs that the user has been listening to on repeat.
- Radio: Spotify’s radio feature creates a bespoke radio station based on listening history. The radio station plays songs similar to the ones that the user has listened to and can be an exciting way to discover new music.
After Disover Weekly’s launch in 2015, more than 40 million listeners had subscribed to the weekly-curated mixtapes. And more than half of those listeners were returning every week for more. Within the first 5 years, Spotify users spent over 2.3 billion hours streaming “Discover Weekly” playlists.
🧪 A/B testing
“At Spotify, we try to be as scientific as possible about how we build our products. Teams generate hypotheses that we test by running experiments — normally in the form of an A/B test — to learn what works and what doesn’t. The learnings give us insights and fuel new product ideas.” Johan Rydberg
Here are some ways in which Spotify uses A/B testing to influence its product design:
- Testing different features: A/B testing is used to experiment with different features, such as new playlist designs, navigation menus, and search functions. By testing these features with different groups of users, Spotify can see which ones are well-received and which aren’t so much.
- Testing user interfaces: Spotify tests interface components, such as the placement of buttons, fonts, and colours. This can provide some insight into what visuals and structures are engaging and more intuitive for users.
- Personalising recommendations: By showing different songs and playlists to different users, Spotify can see which recommendations are more likely to be clicked on and listened to.
- Optimising ads: Spotify uses A/B testing to optimise its advertising. By testing different ad formats, targeting options, and messaging, Spotify can see which ads are more effective at driving engagement and revenue.
🧮 Predictive analytics
Spotify uses predictive analysis in their Discover Weekly playlists, which we spoke about before. The algorithm uses user data to predict which songs a user might like and creates a playlist accordingly.
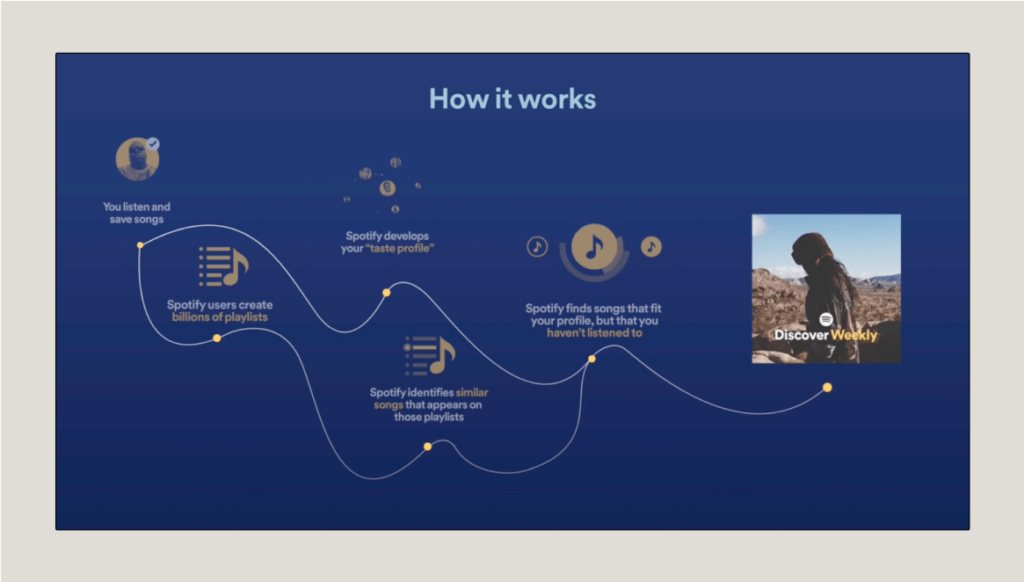
Spotify also uses predictive analysis (a term you might remember from our points on Airbnb above) when when analysing trends. The company can utilise this analytical method to identify emerging trends in music. This allows them to create new playlists and features that are captivating and not too risky as they have the data to back those decisions.
Spotify’s use of data analytics in product design has been a critical factor in its success as a music streaming platform. By collecting vast amounts of user data, including listening behaviour, playlists, search queries, user feedback, and social media engagement, Spotify has been able to create a user experience that feels so tailored and individual to every user. The music mogul’s embracement of data allows them to stay ahead of the competition, and revolutionise the music industry.
Wrap up ✨
The combination of design and data analytics has enabled a multitude of companies to deliver personalised experiences to their users, resulting in an increase in customer satisfaction, engagement and revenue. As illustrated in the examples of Airbnb, Netflix, Amazon and Spotify decisions about product design and development are heavily influenced by data.
By providing such bespoke recommendations and ensuring that users can find what they are looking for quickly and easily, companies can establish a loyal customer base and increase user retention.
Data analytics has become an indispensable tool for businesses to keep up with the ever-evolving user demands and preferences and create innovative products and services that meet their customers’ needs.
If you want to take a peek at how Raw.Studio handles Data Intelligence and Analytics, click here 👈
Get a UX & CRO Expert’s Eyes on Your Website. Book a free 30-minute UX Teardown and get actionable insights on what’s costing you conversions — no fluff, just fixes you can implement right away.
Book a Free UX Audit

Related posts

Gamify Your Goals: How the Goal Gradient Effect Can Hack User Motivation
Tired of staring at mountains of tasks, paralyzed by their insurmountable height? Turns out, our brains have a built-in cheat […]

More Than Homeshare: Learning from Airbnb’s Journey to UX Leadership
Airbnb has revolutionized the travel industry, transforming hospitality from a rigid, standardized experience to a diverse and personalized one. But […]

7 UX Tips for eCommerce to Increase Conversions
UX has a pivotal role to play in increasing revenue. It is usually an overlooked aspect of the checkout process, […]
Creative product design that gets results
Take your company to the next level with world class user experience and interface design.
get a free strategy session
