Top 10 Custom Dashboard Design Tips for 2024
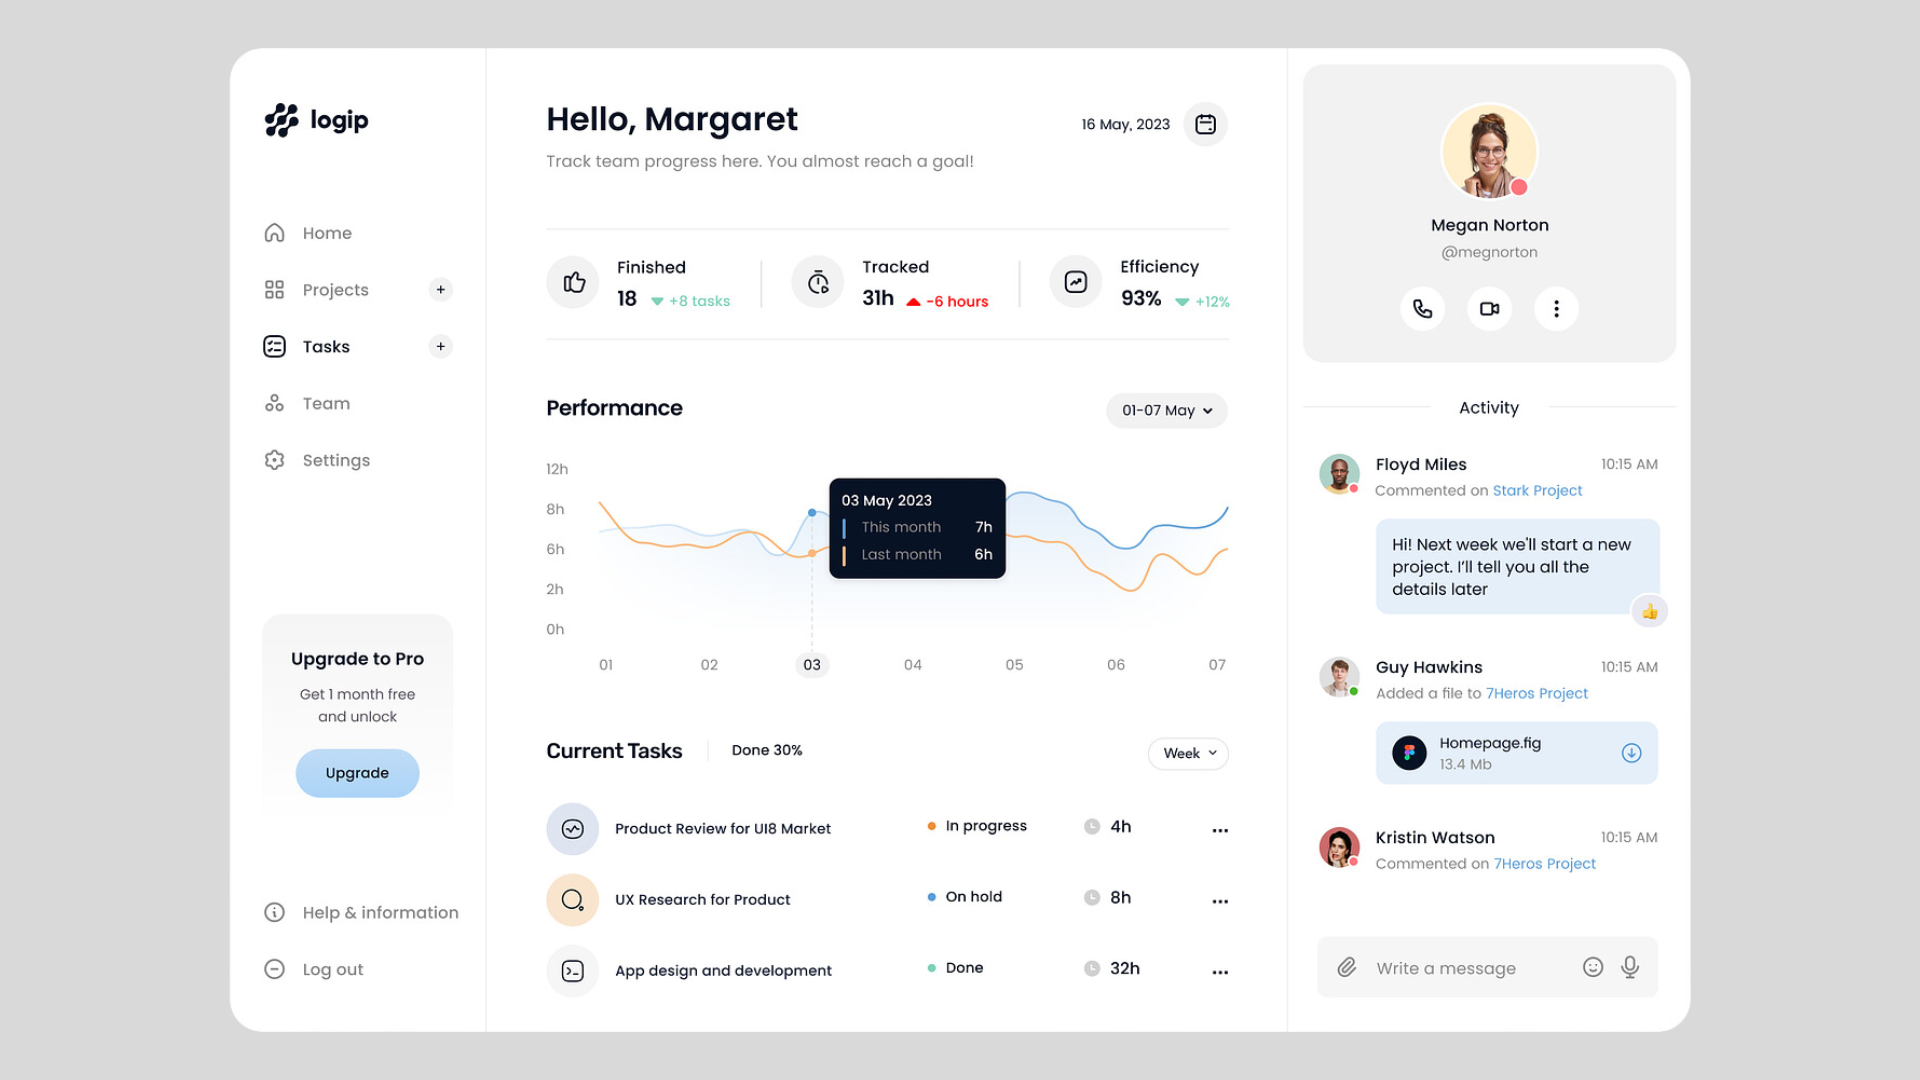
In 2024, data-driven decision-making isn’t just a buzzword—it’s a necessity. As businesses continue to evolve, the ability to make informed decisions quickly can set you apart from the competition. And at the heart of this decision-making process is the custom design dashboard. A well-designed dashboard can transform raw data into actionable insights, making your life—and your job—a whole lot easier. But not all dashboards are created equal. This post will walk you through the top 10 custom dashboard design tips to ensure your dashboards are not only functional but also user-friendly and visually appealing.
Table of Contents
1. Understanding User Needs
Before you dive into designing a custom dashboard, it’s essential to take a step back and consider the people who will be using it. Understanding your users’ needs is the foundation upon which a successful dashboard is built.
Identifying the primary users of the dashboard:
Every dashboard has a specific audience, and identifying who they are is the first crucial step. Are you designing for executives who need a high-level overview of business performance? Or perhaps analysts who require detailed, granular data to make informed decisions? Knowing your audience helps you prioritize what information should be front and center.
Tailoring dashboard features to meet specific user goals:
Once you’ve identified your primary users, the next step is tailoring the dashboard to meet their specific needs. Think about what these users are trying to achieve when they log into the dashboard. Are they monitoring sales trends, tracking project progress, or analyzing customer behavior? Each user group will have different goals, and the dashboard should be designed to help them achieve those goals as efficiently as possible.
Conducting user research and feedback sessions:
To truly understand your users, it’s vital to engage with them directly. Conducting user research through interviews, surveys, and feedback sessions provides invaluable insights into their daily challenges and preferences. This information allows you to design a dashboard that not only meets their needs but also enhances their workflow. Regular feedback sessions after the dashboard is deployed can help you make iterative improvements, ensuring the dashboard remains relevant and user-friendly.
2. Prioritizing Key Metrics
When it comes to custom dashboard design, one of the most important steps is prioritizing the key metrics that will drive your dashboard’s effectiveness. With so much data at our fingertips, it’s easy to get carried away and try to include everything. But remember, not all data is created equal.
Determining the most critical KPIs for the dashboard:
Start by asking yourself, “What information is absolutely essential for my users to make informed decisions?” The answer will lie in the key performance indicators (KPIs) that are most relevant to your users’ goals. Whether it’s sales figures, customer satisfaction scores, or website traffic, identifying these critical KPIs is the first step in creating a custom dashboard design that delivers real value. Focus on the data that directly impacts business outcomes, and make sure these metrics are front and center.
Using hierarchy to highlight essential information:
Once you’ve identified the most important KPIs, the next challenge is making sure they stand out. In custom dashboard design, visual hierarchy is your best friend. Use size, color, and placement to draw attention to the most critical information. The goal is to make it immediately clear to users what they should focus on first. For instance, placing the most vital KPIs at the top of the dashboard or using bold colors to highlight them can help ensure they don’t get overlooked.
Avoiding information overload:
In our data-driven world, it’s tempting to include as much information as possible. But too much data can overwhelm users, making it harder for them to find the insights they need. In custom dashboard design, less is often more. Be selective about the data you include and keep the layout clean and uncluttered. Prioritize clarity over quantity to create a dashboard that’s easy to use and understand. If additional data is necessary, consider using interactive elements like drill-downs or filters to allow users to explore further without crowding the main view.
3. Designing for Responsiveness
In today’s world, people are constantly on the move, accessing data from a variety of devices—be it desktops, tablets, or smartphones. This makes designing for responsiveness a crucial aspect of custom dashboard design. A responsive dashboard ensures that users have a seamless experience, no matter what device they’re using.
Ensuring dashboards are accessible on multiple devices:
Your custom dashboard design needs to be versatile. Whether a user is in the office on a desktop or out in the field on a smartphone, they should be able to access and interact with the dashboard without any hiccups. Designing with this in mind means considering different screen sizes and resolutions from the very beginning. A dashboard that works perfectly on a large monitor but falls apart on a smartphone screen is no longer acceptable in 2024.
Adapting design elements for mobile and desktop views:
Responsive design isn’t just about shrinking things down to fit smaller screens. It’s about thoughtfully adapting the layout and elements to ensure usability across devices. For instance, on a desktop, you might have the space to display multiple data points side by side, but on a mobile device, you might need to stack those elements vertically. Simplify and prioritize the content for mobile users by focusing on the most critical information and using collapsible menus or tabs to keep the interface clean and manageable.
Testing responsiveness across various screen sizes:
Even the best custom dashboard design plans can fall short if they aren’t thoroughly tested. Testing your dashboard across various screen sizes and devices is essential to ensure that it performs well in all environments. Tools like responsive design testing software can help you see how your dashboard looks and functions on different devices. Additionally, real-world testing on actual devices can uncover issues that might not be apparent in simulations.
4. Implementing Data Visualization Best Practices
When it comes to custom dashboard design, how you present data is just as important as the data itself. Implementing data visualization best practices ensures that your users can quickly grasp the insights they need, making the dashboard not just a tool, but a powerful ally in decision-making.
Choosing the right chart types for different data sets:
Not all charts are created equal, and choosing the right one can make a world of difference in how data is interpreted. For example, bar charts are great for comparing quantities, while line charts excel at showing trends over time. Pie charts, on the other hand, are ideal for illustrating parts of a whole. The key to effective custom dashboard design is to match the chart type with the data you’re presenting. This not only makes the information more digestible but also ensures that the insights are clear and actionable.
Using color effectively to convey meaning:
Color is a powerful tool in data visualization, but it needs to be used wisely. In custom dashboard design, color can highlight important information, indicate trends, or differentiate between data sets. However, too much color can overwhelm the user or lead to confusion. Stick to a consistent color scheme, using color to emphasize key data points rather than decorating the dashboard. Additionally, be mindful of color blindness and ensure that your color choices are distinguishable for all users. Tools like colorblind simulators can help you check your design’s accessibility.
Maintaining simplicity in visual elements:
Simplicity is the cornerstone of effective data visualization. While it might be tempting to use complex graphics or multiple chart types to showcase the depth of your data, it’s often better to keep things simple. Avoid cluttering the dashboard with too many visual elements. Each chart, graph, or widget should have a clear purpose and add value to the overall narrative. In custom dashboard design, the goal is to communicate insights quickly and clearly, so simplicity should always be at the forefront of your design choices.
5. Enhancing User Experience (UX)
A well-designed custom dashboard isn’t just about presenting data; it’s about creating an experience that makes interacting with that data effortless and intuitive. Enhancing user experience is key to ensuring that your dashboard is not only functional but also enjoyable to use.
Ensuring intuitive navigation within the dashboard:
Users should be able to find what they need without having to think too hard. Intuitive navigation is crucial in custom dashboard design. Clear menus, logical grouping of information, and easy-to-understand labels go a long way in helping users get to their desired data quickly. Consider implementing breadcrumb trails or a clear navigation bar to guide users through complex datasets.
Implementing search and filter functionalities:
Incorporating robust search and filter features allows users to easily sift through large volumes of data to find exactly what they need. A good search function can quickly pull up relevant data points, while filters let users narrow down information based on specific criteria. These functionalities enhance usability by giving users control over the data they see, making the dashboard more dynamic and responsive to their needs.

Offering customization options for users:
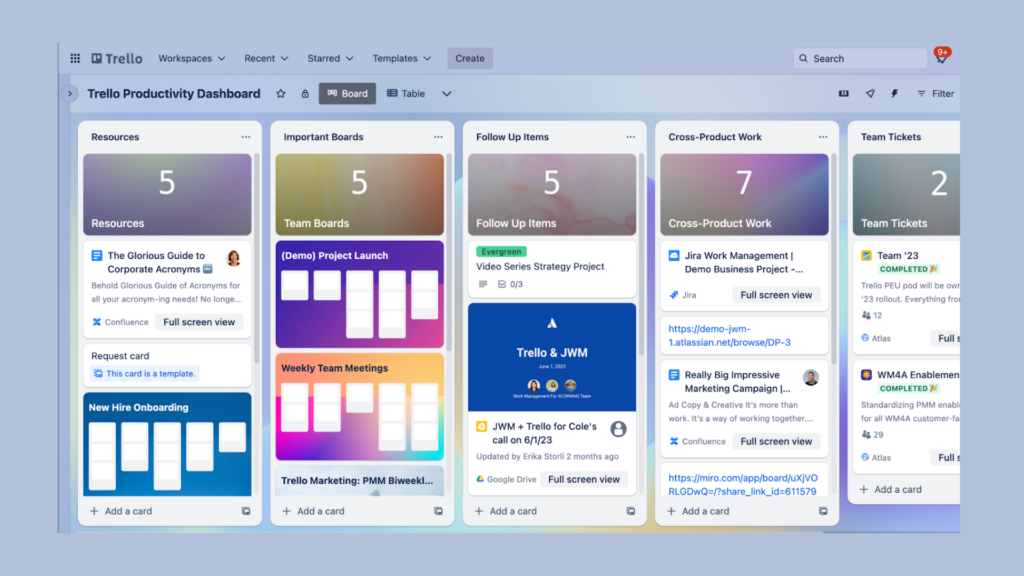
Every user has different needs, and offering customization options allows them to tailor the dashboard to their preferences. Whether it’s the ability to rearrange widgets, choose different chart types, or save personalized views, customization enhances the user experience by making the dashboard feel more personal and relevant.
6. Ensuring Data Accuracy and Timeliness
A dashboard is only as good as the data it presents. Ensuring data accuracy and timeliness is critical in maintaining the reliability and usefulness of your custom dashboard design.
Automating data updates to reflect real-time changes:
In a fast-paced world, real-time data is invaluable. Automating data updates ensures that the information presented on your dashboard is always current, allowing users to make decisions based on the latest insights. Implementing real-time updates also reduces the manual effort needed to keep the dashboard relevant.
Validating data sources for accuracy:
Before data ever reaches your dashboard, it’s essential to validate it for accuracy. Using reliable data sources and implementing checks and balances in your data pipeline can prevent errors from appearing on your dashboard. Regular audits and validation processes help maintain the integrity of the data, ensuring users can trust what they see.
Providing contextual explanations for data points:
Sometimes, data points can be misleading or confusing without proper context. Including brief explanations, tooltips, or links to additional information can help users understand the data more clearly. This is particularly important for complex or unusual metrics, where users might need extra guidance to interpret the numbers correctly.
7. Prioritizing Performance Optimization
A slow-loading dashboard can frustrate users and undermine the effectiveness of your custom dashboard design. Prioritizing performance optimization ensures that your dashboard is responsive and efficient.
Reducing dashboard load times:
Users expect dashboards to load quickly, especially when they’re accessing real-time data. Reducing load times can be achieved by optimizing the size and number of data queries, caching frequently accessed data, and minimizing the use of heavy graphical elements that can slow down performance.
Optimizing queries and data retrieval processes:
Efficiently designed queries and streamlined data retrieval processes are key to a fast and responsive dashboard. Consider using indexed data, pre-aggregated datasets, or optimized query structures to reduce the strain on your system and improve load times. This optimization is particularly important for dashboards that handle large volumes of data.
Minimizing the use of heavy graphical elements:
While visual appeal is important, overloading your dashboard with heavy graphical elements like high-resolution images or complex animations can significantly slow it down. Focus on using lightweight, vector-based graphics and keep animations subtle to maintain a balance between aesthetics and performance.
8. Designing with Security in Mind
In the era of data breaches and cyber threats, designing with security in mind is non-negotiable. Your custom dashboard design should include robust security measures to protect sensitive information and maintain user trust.
Implementing user authentication and access controls:
Secure your dashboard by implementing user authentication mechanisms, such as multi-factor authentication (MFA) and role-based access controls. This ensures that only authorized users can access the dashboard and specific data, reducing the risk of unauthorized access.
Protecting sensitive data through encryption:
Data encryption is a fundamental aspect of dashboard security. Encrypt data both in transit and at rest to protect it from being intercepted or compromised. This is especially crucial for dashboards that handle sensitive or confidential information.
Regularly updating security protocols:
Security threats are constantly evolving, so it’s essential to keep your security protocols up to date. Regularly review and update your dashboard’s security measures to ensure they comply with the latest standards and best practices. This might include software updates, security patches, and regular security audits.
9. Incorporating Interactivity
Interactivity can greatly enhance the functionality and user engagement of your custom dashboard design. By incorporating interactive elements, you create a more dynamic and customizable experience.
Adding interactive elements like drill-downs and hover effects:
Interactive features like drill-downs and hover effects allow users to explore data in greater detail without overwhelming the main dashboard view. Drill-downs enable users to click on a data point to reveal more detailed information, while hover effects can provide quick insights or tooltips when users hover over an element. These features make the dashboard more engaging and informative.
Allowing users to personalize their dashboard views:
Give users the power to customize their dashboard views based on their preferences. Whether it’s rearranging widgets, choosing different visualizations, or saving personalized dashboards, customization options enhance user satisfaction by allowing them to tailor the dashboard to their specific needs.
Utilizing real-time data interaction features:
Real-time data interaction features allow users to manipulate data in real time, such as adjusting time frames or applying filters on the fly. This interactivity provides a more flexible and responsive experience, making the dashboard a powerful tool for real-time decision-making.
Example: Google Data Studio allows users to create interactive dashboards with features like drill-downs and hover effects. Users can personalize their dashboard views by adjusting filters, changing data ranges, and selecting specific metrics, making it a highly interactive and user-driven experience.
10. Future-Proofing Your Dashboard
As your business grows and technology evolves, your dashboard needs to be able to keep up. Future-proofing your custom dashboard design ensures that it remains relevant and scalable in the long term.
Designing with scalability in mind for future data growth:
Your dashboard should be able to handle increased data volume as your business grows. Design with scalability in mind by using flexible data structures, cloud-based solutions, and modular components that can be easily expanded or modified as needed.
Staying updated with the latest dashboard design trends:
Dashboard design trends and best practices are constantly evolving. Stay informed about the latest developments in dashboard design, such as new visualization techniques, UX improvements, and technological advancements. This will help you keep your dashboard up-to-date and competitive.
Planning for regular updates and redesigns:
A dashboard isn’t a set-it-and-forget-it tool. Plan for regular updates and redesigns to keep it aligned with changing user needs, business goals, and technological advancements. Continuous improvement ensures that your dashboard remains a valuable and effective tool for your organization.
Conclusion
Creating effective custom dashboards in 2024 involves a blend of thoughtful design, user-centric features, and robust security measures. Let’s recap the 10 guidelines that can help you craft dashboards that are not only functional but also intuitive and scalable:
- Understanding User Needs: Start by knowing who your users are and tailoring the dashboard to their specific goals.
- Prioritizing Key Metrics: Focus on the most critical data, using visual hierarchy to make important information stand out while avoiding clutter.
- Designing for Responsiveness: Ensure your dashboard looks great and functions well across all devices by optimizing for various screen sizes.
- Implementing Data Visualization Best Practices: Choose the right charts, use color strategically, and keep visual elements simple.
- Enhancing User Experience (UX): Provide intuitive navigation, search and filter functionalities, and customization options to create a seamless user experience.
- Ensuring Data Accuracy and Timeliness: Automate updates, validate data sources, and offer contextual explanations to maintain trust and relevance.
- Prioritizing Performance Optimization: Reduce load times and optimize data processes to keep your dashboard fast and responsive.
- Designing with Security in Mind: Implement strong authentication, protect sensitive data, and regularly update security protocols.
- Incorporating Interactivity: Add interactive elements and real-time data features to make your dashboard more engaging and useful.
- Future-Proofing Your Dashboard: Plan for scalability, stay updated with trends, and schedule regular updates to keep your dashboard relevant.
By implementing these guidelines, you can create custom dashboards that not only look good but also deliver meaningful insights, empowering your team to make better data-driven decisions.
If you’re looking for expert custom dashboard designers to help bring your vision to life, consider visiting Raw Studio. Their team specializes in creating tailored solutions that meet your specific needs, ensuring you get the most out of your data. Don’t miss the opportunity to elevate your dashboard design and achieve better results!
Take your company to the next level and get results with our world class user experience, interface design and implementation.
Get a FREE 30 min Strategy Session

Related posts
First Impressions Matter: Crafting Compelling User Onboarding Experiences
User onboarding has become more crucial than ever in today’s fiercely competitive digital landscape, where countless applications and platforms vie […]
YouTube Tests a Hum-Based Song Search Feature: Revolutionizing Music Discovery
In the ever-evolving world of technology and entertainment, YouTube continues to push the boundaries of what’s possible on its platform. […]
The Correct Way to Embed Accessibility in Your Design Process
No fancy introduction – 15% of the world’s population equivalent to more than 1 billion people live with some sort […]
Creative product design that gets results
Take your company to the next level with world class user experience and interface design.
get a free strategy session


